University of Tennessee at Martin · Embry-Riddle Aeronautical University · CYBER-CARE Symposium

Machine Learning–Based Anomaly Detection for IoT Transportation Networks

A comparative study of five ML algorithms against 1.2M+ network flow records, 11 attack types, and a V2V communication threat model — with XGBoost achieving 99.99% AUC-ROC and Decision Tree outperforming deep learning in multi-class classification.

Researchers Connor Gladish & Molly Corgan
Dataset ACI-IoT-2023
Models Evaluated 5 Algorithms
Top Accuracy >99.5%
Scroll to explore
1.2M+
Network Flow Samples
11
Distinct Attack Types
5
ML Algorithms Compared
0.9999
Best AUC-ROC (XGBoost)

Why connected vehicles
are under attack

As autonomous vehicles, V2V communication, and smart infrastructure become critical to modern transportation, protecting these systems from cyber threats is no longer optional. A compromised network channel can cause an AI to misclassify a pedestrian as drivable road surface — with lethal consequences.

"An adversarial payload injected through a compromised V2X channel can cause a vehicle's AI to see a pedestrian as drivable road — and accelerate toward them."

— Core research motivation for real-time intrusion detection
V2V Communication Hijacking
Vehicle-to-vehicle channels are vulnerable to man-in-the-middle attacks that can silently modify the data exchanged between vehicles in real time, corrupting navigation decisions.
High Severity
DDoS on Smart Infrastructure
Flooding attacks against traffic management systems can cause widespread traffic disruption, block emergency vehicle routing, and degrade signal control across entire regions.
Infrastructure
Adversarial Perception Attacks
Adversarial noise injected through compromised channels corrupts the camera feed processed by a vehicle's semantic segmentation model, causing catastrophic misclassification of road hazards.
Safety-Critical
Fleet Ransomware & Exfiltration
Fleet management systems hold sensitive telemetry, route data, and vehicle identifiers. Ransomware locks out operators while data exfiltration enables targeted follow-on attacks.
Data Risk

ACI-IoT-2023 Dataset

The Army Cyber Institute's 2023 IoT network traffic dataset provides 1.23 million labelled network flows across 11 attack categories, making it one of the most comprehensive IoT intrusion detection benchmarks available.

Dataset Statistics

Total samples 1,231,406
Features per flow 78
Attack categories 11 classes
Source Army Cyber Institute

Preprocessing Applied

Rare class threshold <100 samples removed
Training sample size 500,000 (stratified)
Split ratio 70 / 15 / 15
Scaling method StandardScaler (train only)

Class Distribution

Port Scan35.8%
Benign26.7%
ICMP Flood18.3%
Ping Sweep5.8%
DNS Flood3.8%
Vulnerability Scan3.2%
OS Scan3.0%
Slowloris1.5%
SYN Flood1.1%
Dictionary Attack0.5%
UDP Flood0.06%

The Training Pipeline

Every experiment follows a nine-step pipeline designed to prevent data leakage, ensure fair class representation, and enable controlled comparison across all five algorithms. Each step is documented with the exact code used in training.

01
Data Ingestion

Raw Data Loading & Rare Class Removal

The 88.8 GB CSV file with 1,231,411 records and 78 features is loaded. Attack classes with fewer than 100 samples (specifically ARP Spoofing) are removed to ensure reliable stratified partitioning. The filtered dataset retains 11 attack classes plus Benign.

02
Label Engineering

Dual Target Construction

Two parallel label arrays are constructed — a multi-class integer-encoded array (0–10) and a binary array (0 = benign, 1 = attack). Non-predictive identifier columns like IP addresses, timestamps, and flow IDs are dropped at this stage.

from sklearn.preprocessing import LabelEncoder
le = LabelEncoder()
y_encoded = le.fit_transform(df['label'])
y_binary = (df['label'] != 'benign').astype(int)
03
Preprocessing

Categorical Encoding & Data Cleaning

All categorical columns are integer-encoded independently. NaN values are imputed with column-wise mean. Infinite values — which arise when flow denominators approach zero — are replaced with NaN then filled with zero. Final feature dimensionality: ~47–50 features.

04
Sampling

Stratified Downsampling to 500K

Training KNN and Random Forest on 1M+ records is computationally prohibitive. A stratified sample of exactly 500,000 records is drawn with random_state=42, preserving each class's proportional representation. UDP Flood's 791 total records produce only ~321 sampled records — the root cause of its universally poor recall.

X_s, _, y_e_s, _, y_b_s, _ = train_test_split(
    X, y_encoded, y_binary,
    train_size=500000,
    stratify=y_encoded,
    random_state=42
)
05
Splitting

Train / Validation / Test Split (70/15/15)

Two sequential stratified splits produce ~350K training, ~75K validation, and ~75K test records. The test set is fully isolated before any model fitting and accessed exactly once — at final evaluation — to prevent any form of data leakage.

06
Feature Scaling

StandardScaler — Train Set Only

All features are standardized to zero mean and unit variance. Critically, the scaler is fit exclusively on the training set and applied without refitting to validation and test sets, preventing data leakage. Although tree models are scale-invariant, XGBoost gradient updates, KNN distance computations, and CNN gradient flow all depend on feature magnitude — uniform scaling ensures performance differences reflect algorithms, not scale artifacts.

scaler = StandardScaler()
X_train_scaled = scaler.fit_transform(X_train) # fit only on train
X_val_scaled = scaler.transform(X_val) # no refit
X_test_scaled = scaler.transform(X_test) # no refit
07
Training

Binary Classification — All 5 Models

All five classifiers are trained on the binary-labeled training set. Wall-clock training time is recorded. ROC curve data and predicted class probabilities are computed on the held-out test set for all five models.

08
Training

Multi-Class Classification — 11 Attack Types

The same five classifiers are retrained on the multi-class labels with two modifications: XGBoost switches to multi:softmax with num_class=11, and the CNN output layer changes from a single sigmoid to an 11-unit softmax. All other hyperparameters remain identical for controlled comparison.

xgb_multi = xgb.XGBClassifier(
    n_estimators=100, max_depth=10,
    objective='multi:softmax',
    num_class=11, eval_metric='mlogloss'
)
09
Evaluation

Comprehensive Metrics & Serialization

For each model and task, the following are computed on the held-out test set: accuracy, weighted precision/recall/F1, AUC-ROC (binary), confusion matrix, per-class classification report, and wall-clock training time. All results are serialized to aci_comprehensive_results_with_knn.json.


Five Models, One Winner

From a simple Decision Tree to a 1D Convolutional Neural Network, each algorithm brings different inductive biases to bear on the problem of network intrusion detection. The results reveal which assumptions best match this data.

Decision Tree
Single Learner · Axis-aligned splits

Deterministic depth-20 tree. Creates explicit, inspectable rules. Fastest to train among models with a training phase. Surprisingly outperforms ensembles in multi-class classification.

99.77%
Binary Acc.
99.56%
Multi-Class
Random Forest
Ensemble · Bagging · 100 trees

Bootstrap aggregation across 100 independent trees. Superior AUC calibration over the single tree but slightly more false positives due to ensemble voting on borderline flows.

99.72%
Binary Acc.
99.43%
Multi-Class
KNN
Instance-Based · Lazy Learner · k=5

No training phase — classifies by majority vote of 5 nearest Euclidean neighbors. Structurally disadvantaged by uniform feature weighting and Port Scan's overwhelming density in feature space.

99.57%
Binary Acc.
99.24%
Multi-Class
1D Convolutional Neural Network
Deep Learning · 3× Conv1D blocks · 67K parameters

Treats 78 flow features as a 1D sequence with kernel_size=3. Three convolutional blocks (64→128→64 filters) with BatchNorm, ReLU, and MaxPooling, followed by GlobalAveragePooling and two Dense layers with Dropout(0.3). Binary runs 13 epochs; multi-class 9 epochs before early stopping. Despite GPU acceleration, trails all classical models — the convolutional inductive bias for spatially local correlations does not apply to independently-computed tabular flow statistics.

99.24%
Binary Acc.
98.34%
Multi-Class
67,265
Parameters
1.25 min
Train Time

The Numbers

All five models were evaluated on a fully held-out test set of ~75K records. Results span binary and multi-class tasks across accuracy, precision, recall, F1-score, AUC-ROC, and wall-clock training time.

Model Accuracy Precision Recall F1-Score AUC-ROC Train Time
Decision Tree
99.77%
99.87% 99.83% 99.85% 0.9968 0.17 min
Random Forest
99.72%
99.79% 99.83% 99.81% 0.9999 0.31 min
XGBoost ★
99.74%
99.82% 99.83% 99.82% 0.9999 0.08 min
KNN
99.57%
99.70% 99.71% 99.70% 0.9980
1D CNN
99.24%
99.43% 99.53% 99.48% 0.9990 1.25 min
Model Accuracy Precision Recall F1-Score Train Time
Decision Tree ★ 99.56% 99.54% 99.56% 99.55% 0.12 min
XGBoost 99.52% 99.52% 99.52% 99.51% 0.54 min
Random Forest 99.43% 99.42% 99.43% 99.41% 0.31 min
KNN 99.24% 99.24% 99.24% 99.23%
1D CNN 98.34% 98.40% 98.34% 98.33% 0.89 min
Attack Type Precision Recall F1-Score Test Samples
ICMP Flood 99.99% 99.99% 99.99% 13,718
Ping Sweep 99.98% 100.00% 99.99% 4,381
SYN Flood 100.00% 99.76% 99.88% 844
OS Scan 99.83% 99.91% 99.87% 2,286
Benign 99.55% 99.79% 99.67% 20,056
DNS Flood 99.86% 99.37% 99.61% 2,859
Port Scan 99.55% 99.54% 99.55% 26,877
Dictionary Attack 98.73% 100.00% 99.36% 388
Slowloris 99.74% 99.82% 99.78% 1,135
Vulnerability Scan 96.03% 95.51% 95.77% 2,408
UDP Flood ⚠ 60.87% 29.17% 39.44% 48

Best multi-class model: Decision Tree. UDP Flood failure is a data problem (only 48 test samples), not a model problem.


Three features decide everything

Random Forest's Gini impurity-based feature importances reveal a striking concentration: the top three packet-header features account for nearly 80% of all classification decisions — making deep packet inspection unnecessary for real-time deployment.

01 RST Flag Count
28.34%
Protocol Flag
02 Fwd Header Length
27.62%
Packet Structure
03 Source Port
23.69%
Network Addressing
04 Bwd Packet Length Max
5.22%
Packet Size
05 Fwd Packet Length Max
2.76%
Packet Size
06 Connection Type
2.18%
Network Type
07 Fwd Seg Size Min
1.97%
Segmentation
08 Flow IAT Min
1.74%
Timing
79%
Top 3 Features Drive All Decisions
RST Flag Count (28.3%), Forward Header Length (27.6%), and Source Port (23.7%) collectively account for 79.65% of all classification decisions. Any two attack classes sharing similar values on these three features will be confused by every model.
RST
DDoS and Port Scans Leave a Flag
RST Flag Count is consistently elevated in DDoS attacks and port scans, which generate TCP resets when connections are rejected. Benign traffic produces RST flags only during normal teardown — a much lower and more consistent rate.
Edge Deployment Without DPI
Because the top features are all available in packet headers without decrypting payload content, lightweight real-time deployment is feasible on V2X infrastructure and resource-constrained IoT edge devices — no deep packet inspection required.

Why the CNN underperformed

The 1D CNN achieved strong absolute accuracy but trailed every classical model. Understanding why reveals a fundamental mismatch between convolutional inductive biases and the structure of tabular network flow data.

Architecture

Input 78 flow features (N, 78, 1)
Conv1D (64 filters) kernel=3, same padding (N, 78, 64)
BatchNorm + ReLU
MaxPooling1D pool_size=2 (N, 39, 64)
Conv1D (128 filters) kernel=3, same padding (N, 39, 128)
BatchNorm + ReLU
MaxPooling1D pool_size=2 (N, 19, 128)
Conv1D (64 filters) kernel=3, same padding (N, 19, 64)
GlobalAveragePool positional info lost (N, 64)
Dense(128) + Drop(0.3)
Dense(64) + Drop(0.3)
Output sigmoid (binary) / softmax×11 67,265 / 67,915 params

Why It Falls Short

Wrong Inductive Bias

Conv1D with kernel_size=3 assumes features at positions N, N+1, and N+2 are correlated — like adjacent pixels in an image. For ACI-IoT-2023, features are independently computed flow statistics placed in arbitrary CSV column order. The kernels learn correlations between meaningless neighbor groupings.

GlobalAveragePooling Dilutes RST Signal

After convolution, GlobalAveragePooling averages all 19 remaining positions into a single 64-dimensional vector — burying RST Flag Count (the single most predictive feature at 28.3% importance) together with 63 other activations. Tree models split on RST alone and first.

315 False Positives: The Threshold Problem

Benign flows with legitimately elevated RST counts (TCP teardowns) produce sigmoid scores clustered around 0.52 — just above the hard 0.5 threshold. Tree models confidently route these to a benign leaf; the CNN's averaged activations leave them stranded at the decision boundary.

Strong AUC Despite Lower Accuracy

The CNN's AUC of 0.9990 ranks third overall — better than KNN (0.9980) and Decision Tree (0.9968). Well-calibrated probability outputs mean the CNN remains useful in deployments where threshold tuning matters more than hard accuracy at 0.5.

No Overfitting — Architecture Ceiling

Both binary (epoch 13) and multi-class (epoch 9) runs show tight train/validation loss gaps throughout training. Early stopping triggered not from overfitting but because the architecture hit its performance ceiling — no additional epochs would help.


Why each model
made mistakes

A root-cause breakdown of model errors across both tasks, grounded in the pipeline code and dataset characteristics. Before blaming any algorithm, several upstream decisions in the pipeline create error conditions every model inherits.

Decision Tree Tree
Binary — False Positives
Legitimate TCP connections send RST flags during teardown. A benign session with elevated RST count passes the tree's top split threshold and lands in the attack subtree with no recovery path.
Multi-Class — Port Scan / Vuln Scan Confusion
Both attack types show elevated RST counts and varied source ports. Flows at the exact Fwd Header Length boundary get assigned to whichever leaf saw more training examples — producing off-diagonal confusion matrix cells.
Random Forest Ensemble
Binary — More FP than Decision Tree
Ensemble voting on borderline benign flows creates slim majority verdicts (60–40). Flows that the single tree confidently routes as benign flip to attack when 40 of 100 bootstrap trees learned that RST range as an attack cluster.
Multi-Class — Bootstrap Destroys UDP Flood
~53 of 100 trees have zero UDP Flood training samples due to bootstrap sampling of only 321 available records. The majority vote has no UDP Flood signal and routes those flows to the nearest large class.
XGBoost Boosting
Binary — Aggressive Learning Rate
lr=0.1 causes later boosting rounds to overfit on hard borderline examples. Lower lr (0.01–0.05) with more estimators would smooth boundary cases without hurting overall accuracy.
Multi-Class — Softmax Calibration Loss
multi:softmax outputs hard integer labels with no probability calibration. Using multi:softprob would enable threshold tuning for minority classes and likely improve Port Scan / Vulnerability Scan boundary decisions.
KNN Instance
Binary — Uniform Feature Weighting
All 47 features contribute equally to Euclidean distance. RST Flag Count (28.3% importance) carries the same distance weight as Dst IP (1.6%). A flow can appear "close" to the wrong class purely from matching irrelevant features.
Multi-Class — Density Dominance
Port Scan's ~178K training records dominate neighborhoods. Borderline flows are statistically likely to have Port Scan neighbors regardless of their true class, producing systematic Port Scan misclassification at the boundaries.
!!
UDP Flood: A Universal Failure — and It's a Data Problem

UDP Flood recall hovers at 20–30% across all five models. The cause is identical for each: only 791 total samples in the raw dataset produce only 48 test samples after stratified splitting. No algorithm can learn a reliable decision boundary from this. The fix is in the data pipeline — applying SMOTE oversampling to generate ~5,000 synthetic UDP Flood samples before splitting would give all models a learnable signal. This is a data problem, not a model problem.


What this research proves

Six takeaways from this study with direct implications for how machine learning should be deployed in IoT transportation security contexts.

01
Classical ML Outperforms Deep Learning for Tabular NIDS

The CNN (98.34% multi-class F1) underperformed every classical model (99.23–99.55%). For structured tabular network flow data with strong feature-level signals, tree-based methods are more appropriate than convolutional architectures. The CNN's inductive bias for local spatial correlations has no valid analog in hand-engineered flow statistics.

02
XGBoost is Optimal for Production Deployment

Best AUC-ROC (0.9999), fastest classical training (0.08 min binary), and near-optimal F1 (99.82% binary, 99.51% multi-class). The ensemble method's resistance to overfitting combined with well-calibrated probability outputs makes it ideal for deployments requiring adaptive threshold tuning based on operational safety requirements.

03
Decision Tree Excels at Multi-Class Classification

The simplest model outperformed every ensemble and the CNN in multi-class classification (99.56% vs. 98.34% CNN, 99.52% XGBoost). Multi-class problems with distinct attack signatures benefit from crisp decision boundaries rather than ensemble averaging or convolutional feature extraction, which blur class-specific thresholds.

04
Class Imbalance Remains the Critical Unsolved Challenge

UDP Flood recall of 29% across all models despite strong overall accuracy reveals that class imbalance cannot be solved by algorithm selection alone. SMOTE oversampling for rare attack classes should be integrated into the pipeline before any future experiments — improving minority class detection without degrading majority class performance.

05
Packet Headers Are Sufficient — No Deep Packet Inspection Needed

79.65% of classification decisions rely on just three features: RST Flag Count, Forward Header Length, and Source Port — all available from packet headers without decrypting payload content. This enables real-time deployment on resource-constrained V2X infrastructure, embedded vehicle systems, and IoT edge devices.

06
Training Efficiency Supports Continuous Learning at the Edge

XGBoost (0.08 min binary) and Decision Tree (0.12 min multi-class) train fast enough to support periodic retraining as attack patterns evolve — directly on the edge device, without requiring cloud offload. This is critical for V2V environments where network connectivity may be intermittent and latency requirements are strict.


Research Figures

All visualizations produced by the study — click any figure to download it.
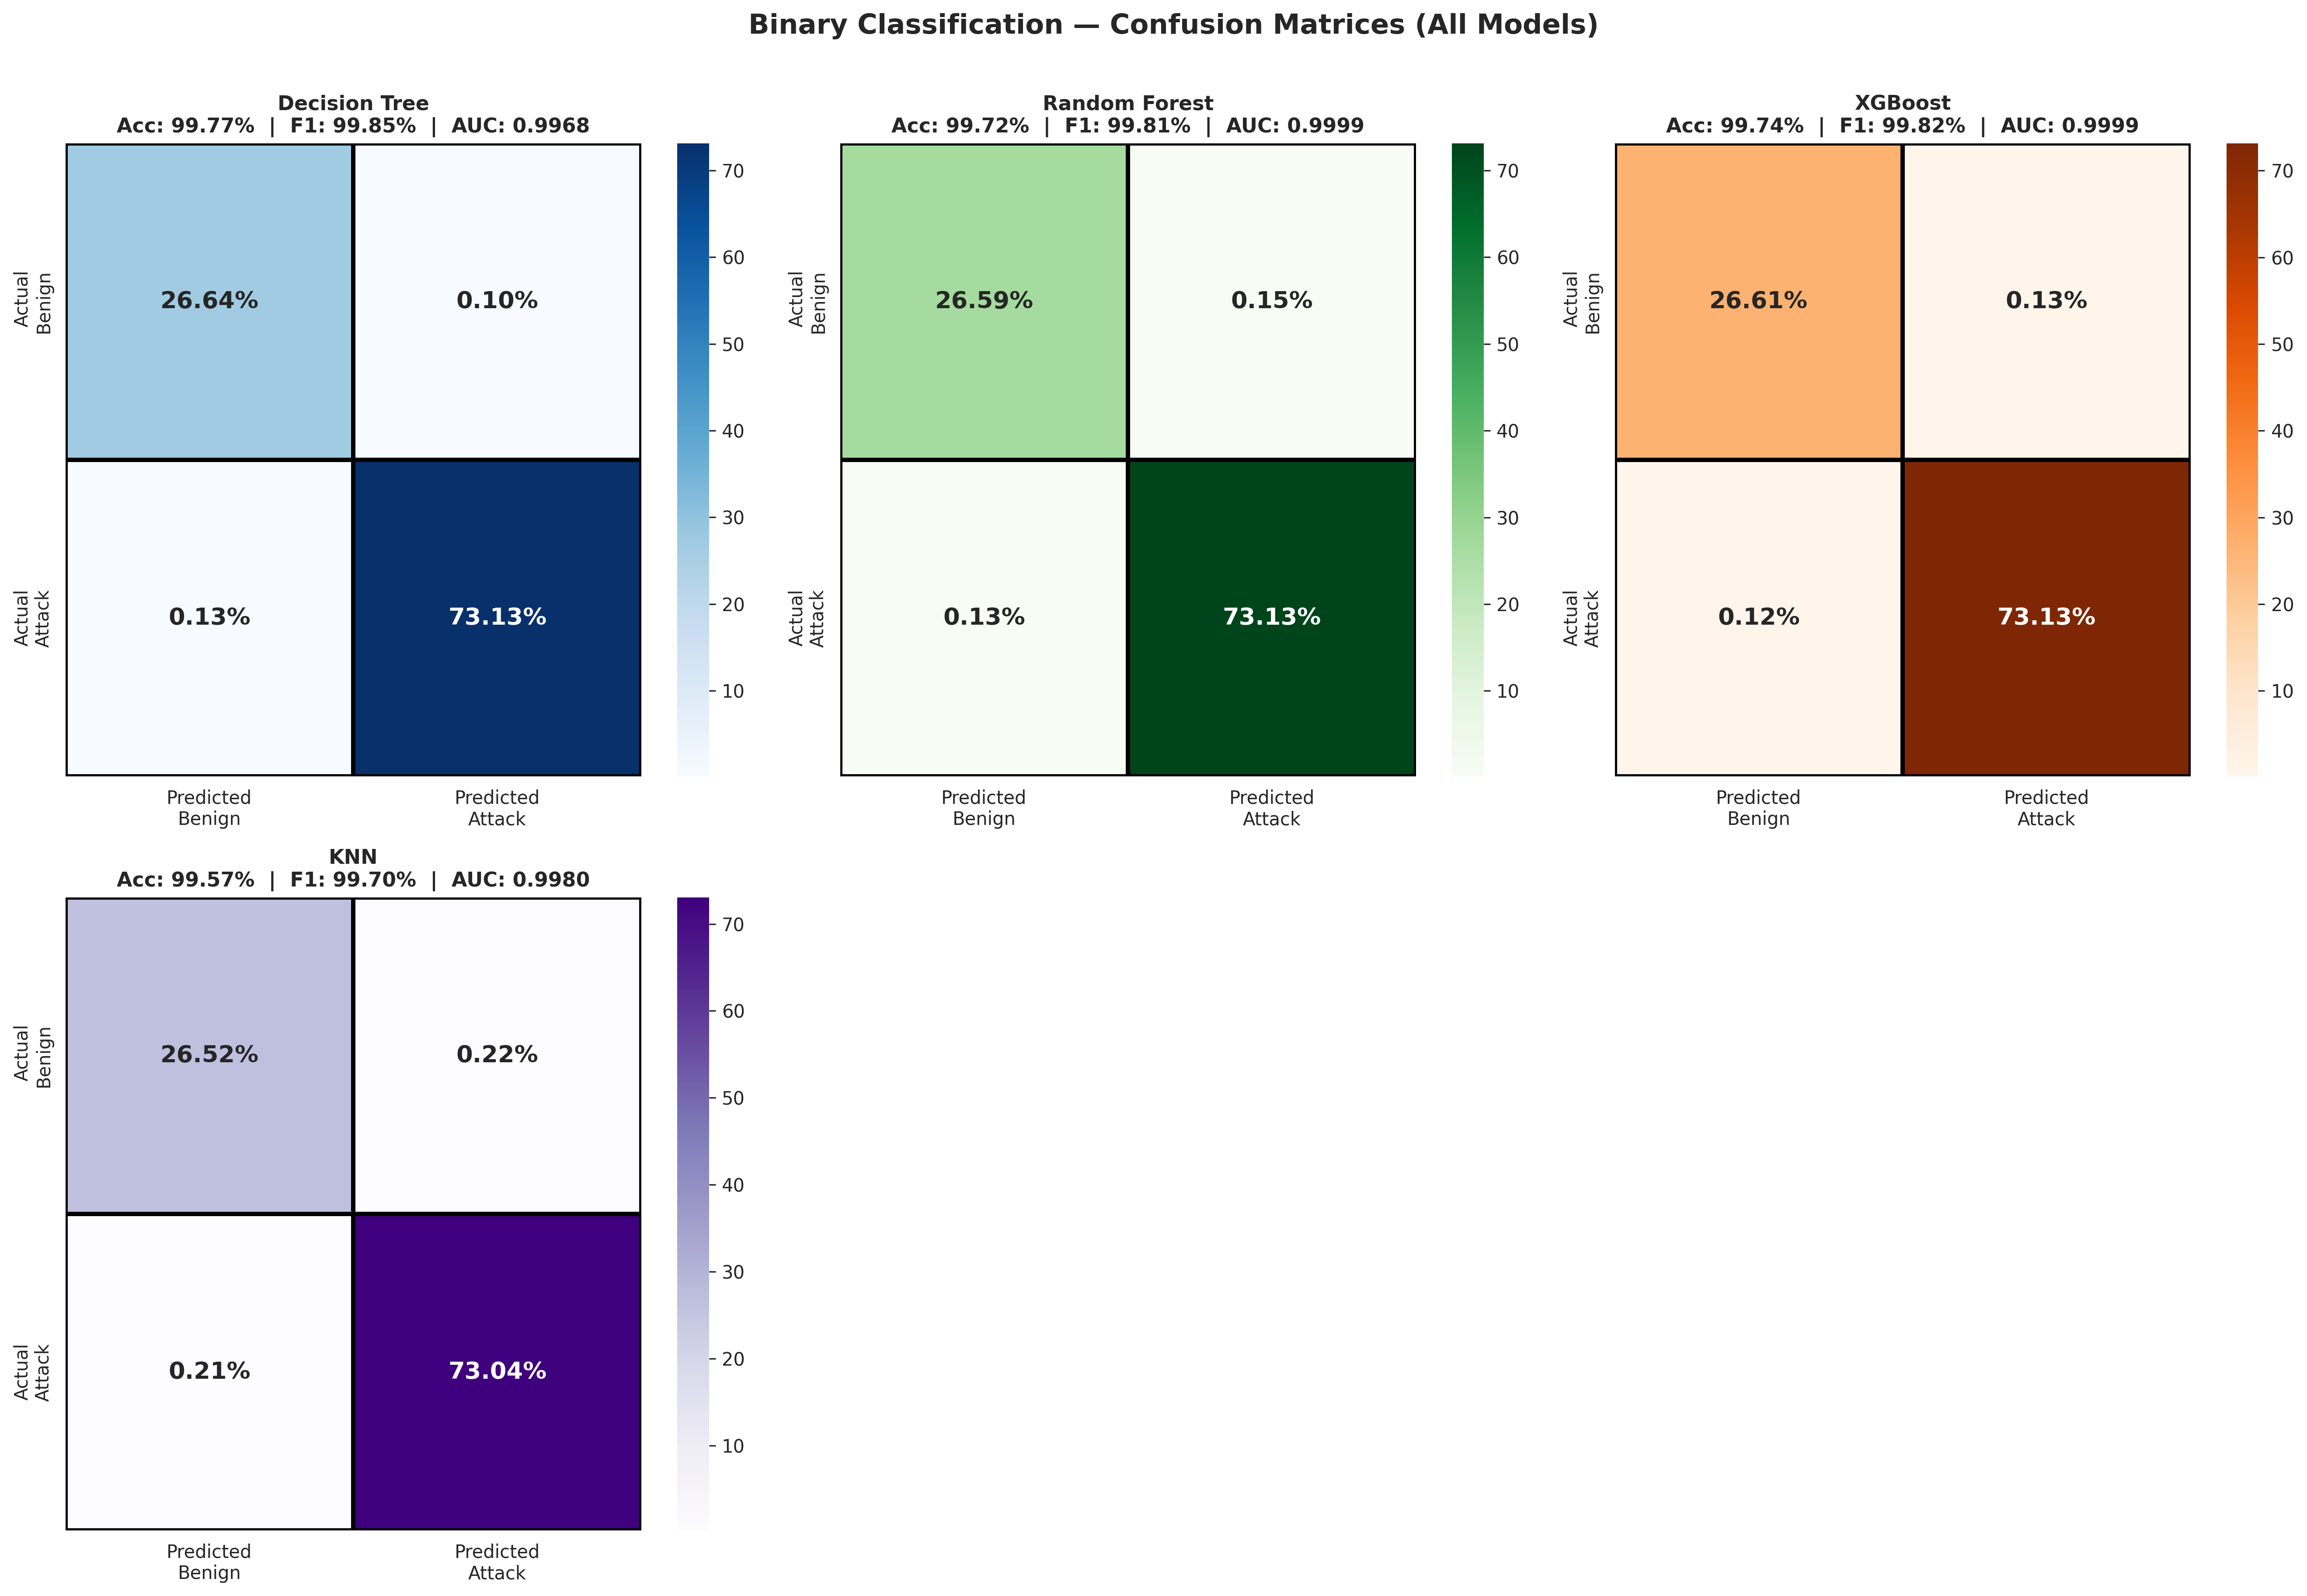
Fig. 1
Binary classification confusion matrices — all 5 models
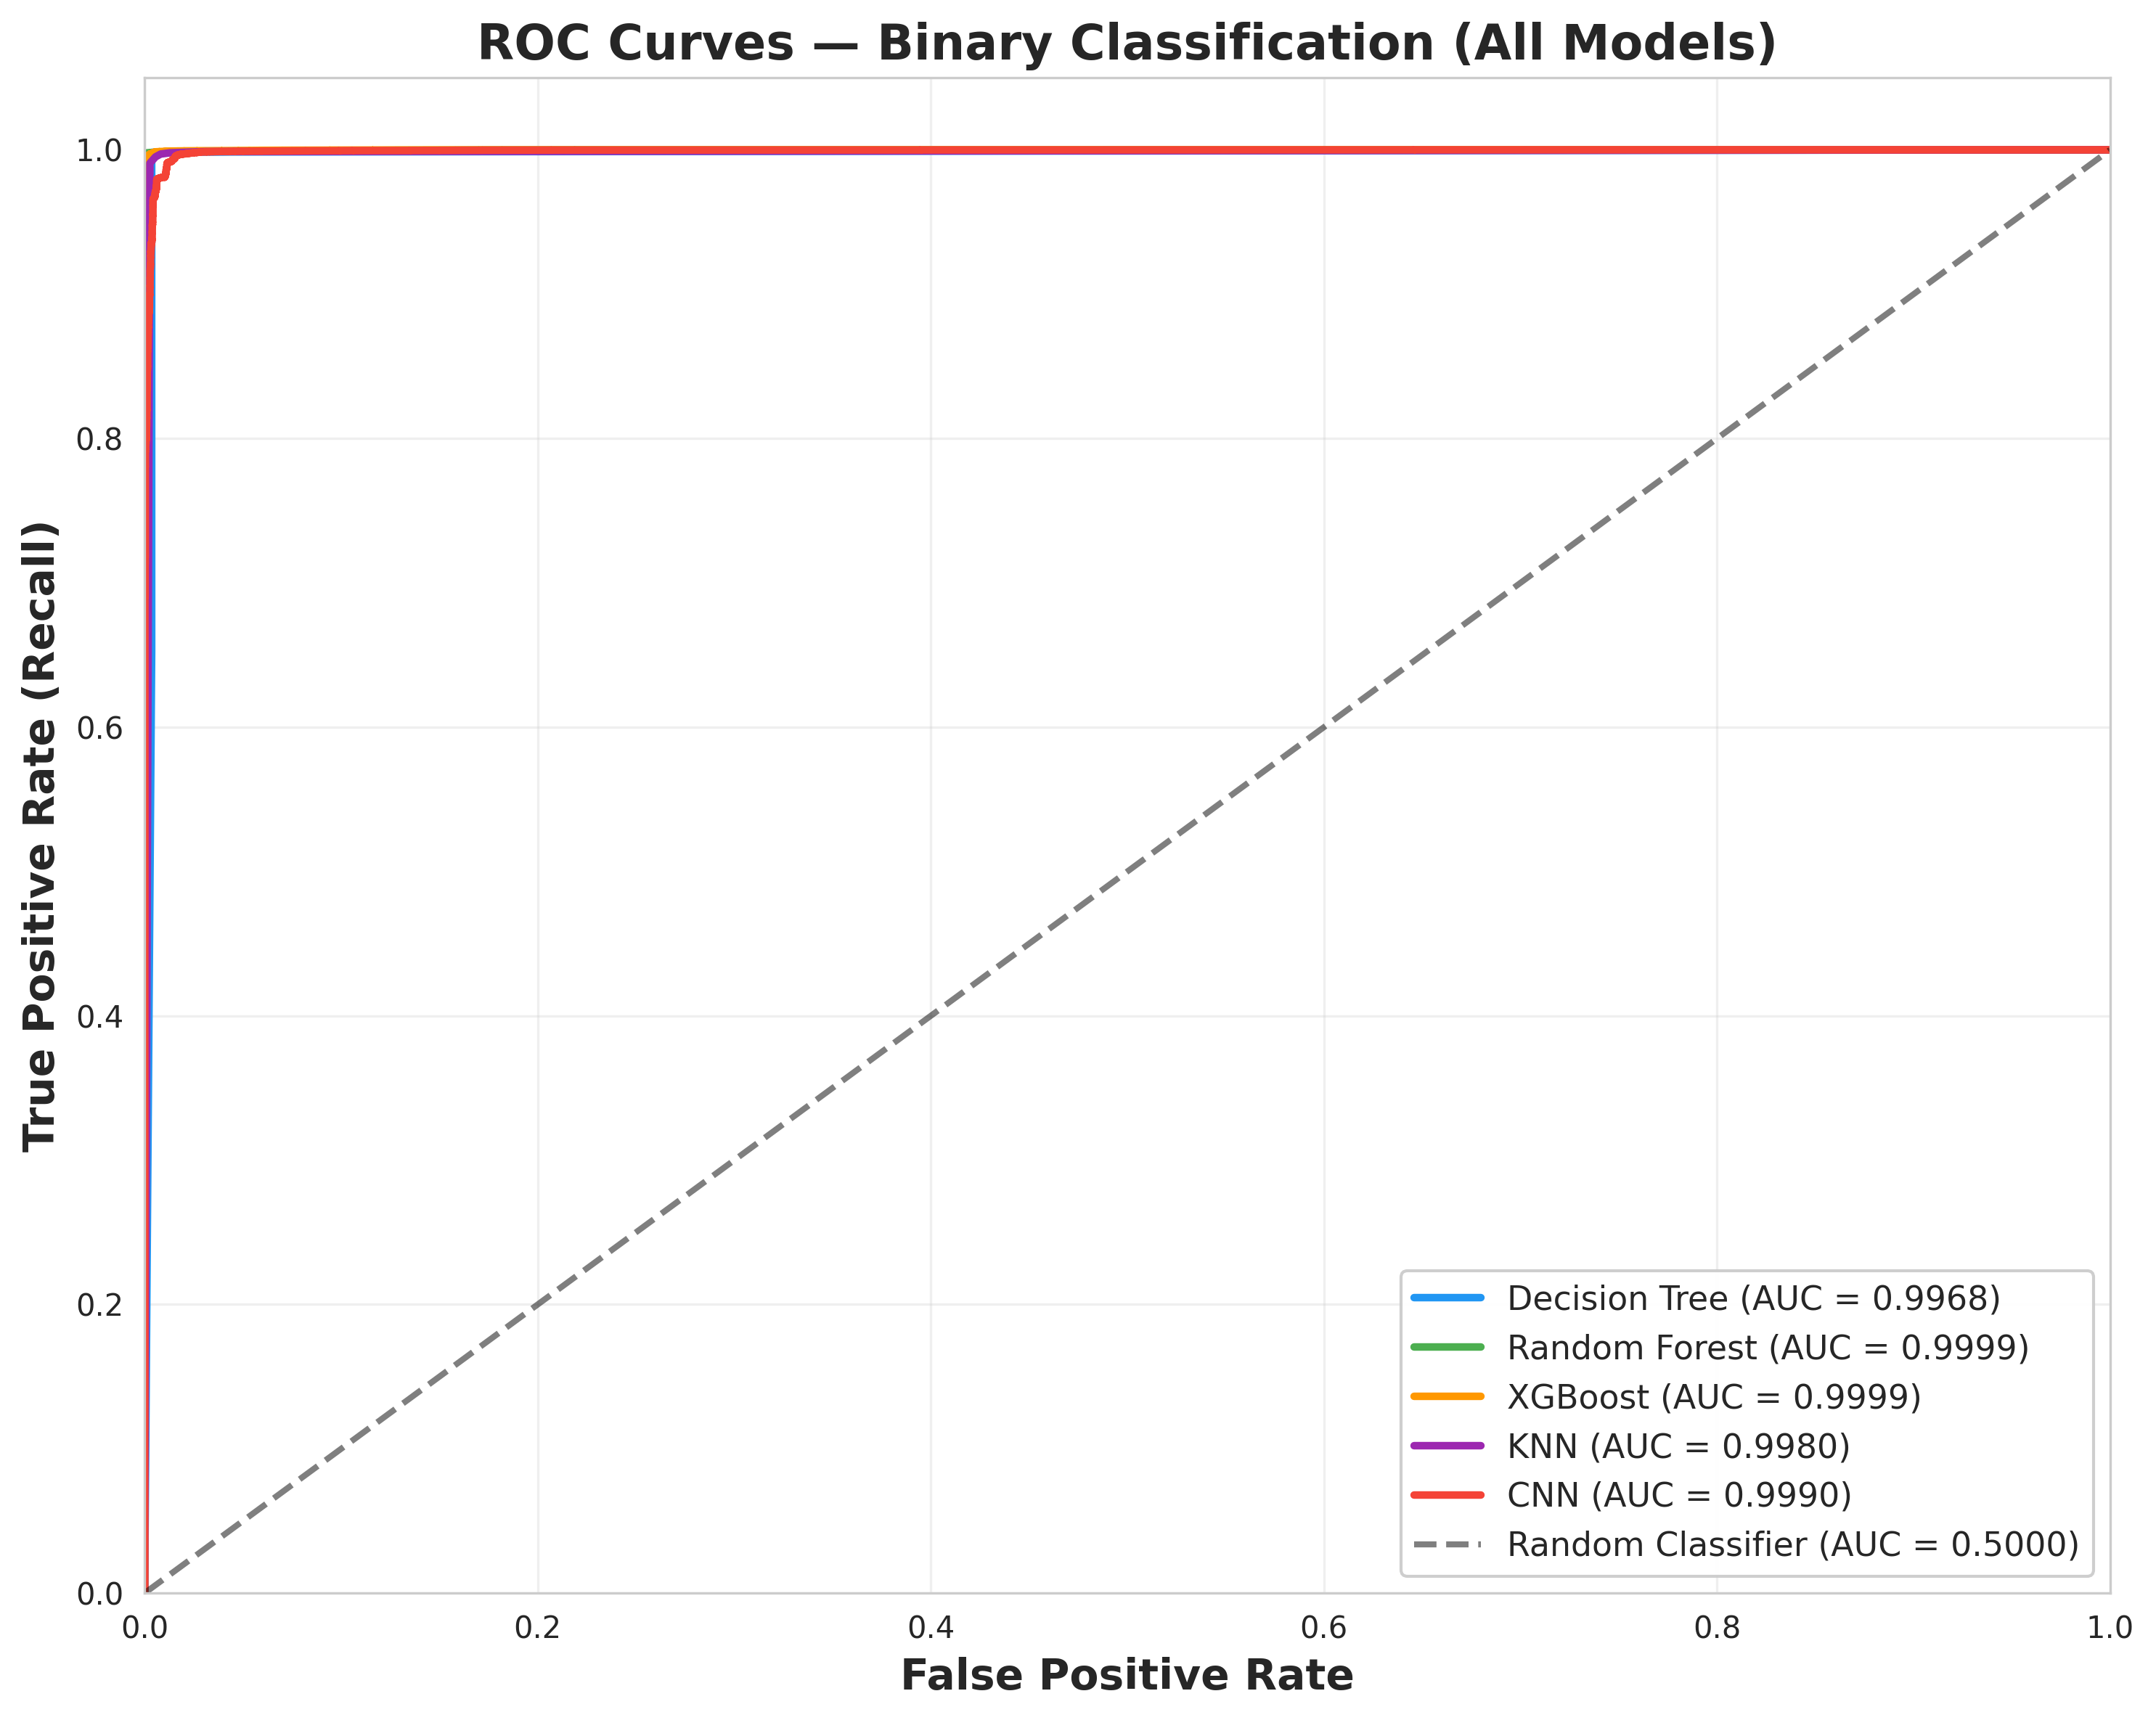
Fig. 2
Full ROC curves — binary classification
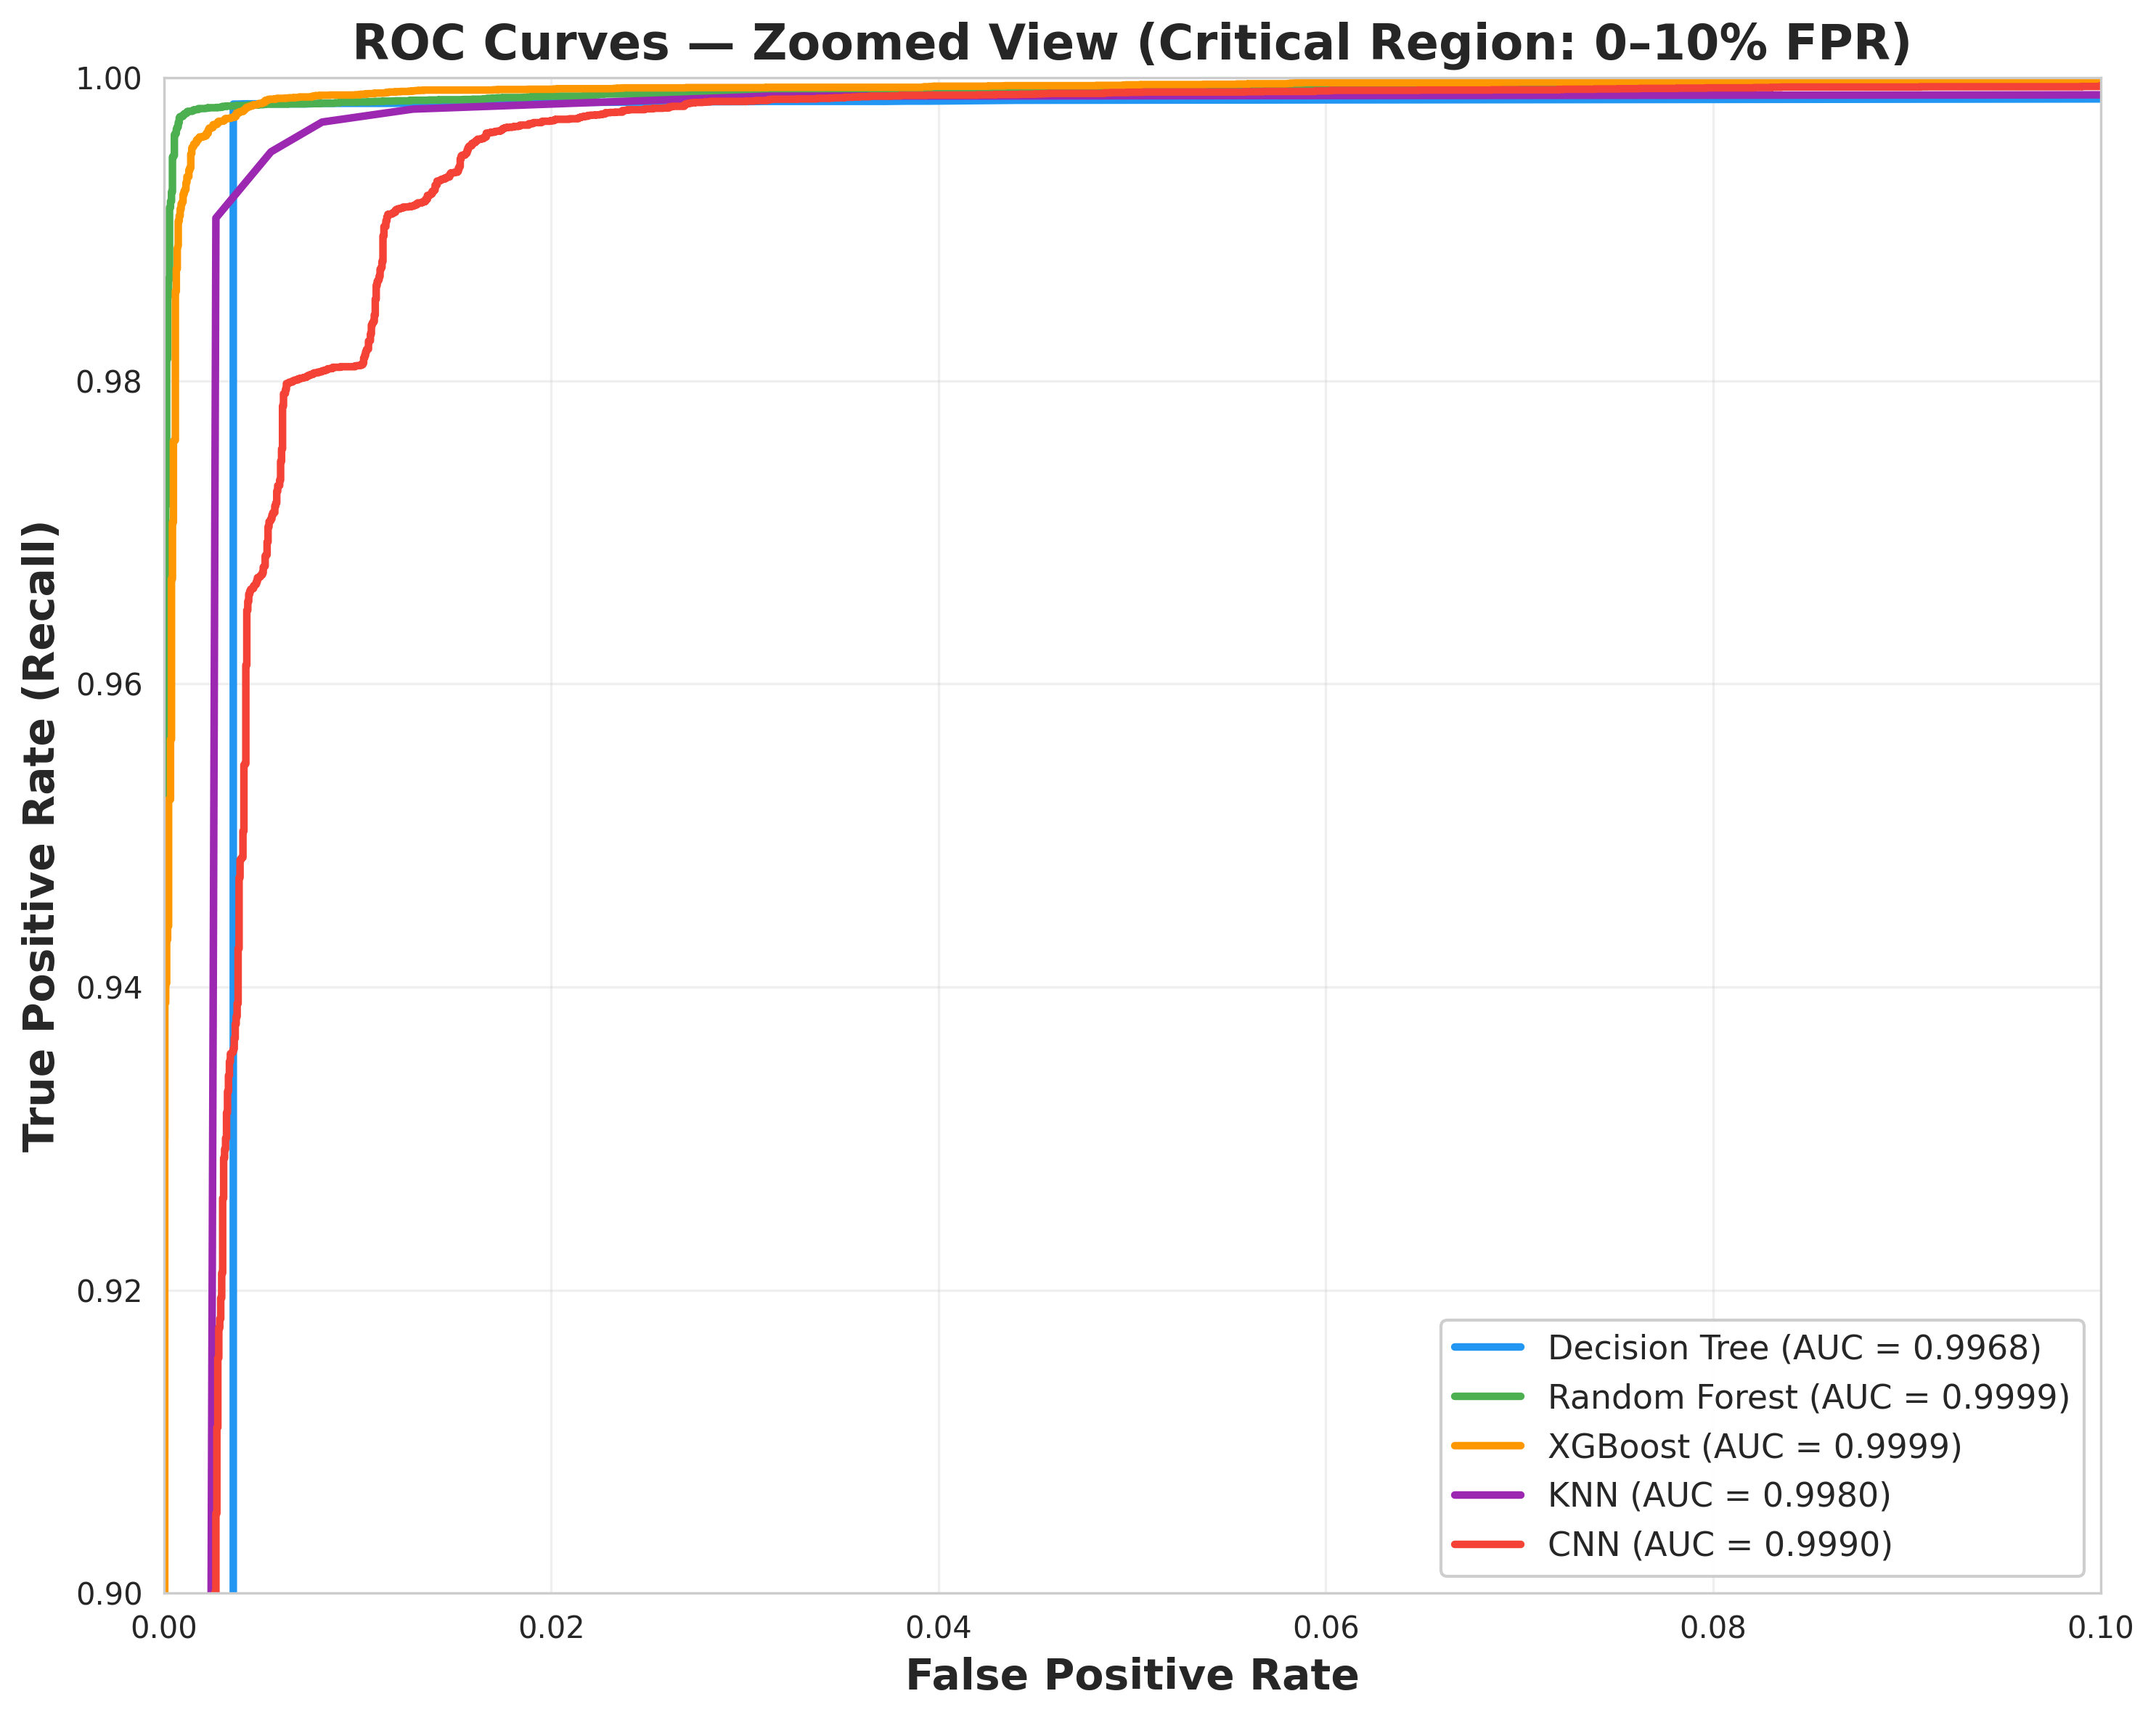
Fig. 3
ROC zoomed — critical low-FPR region
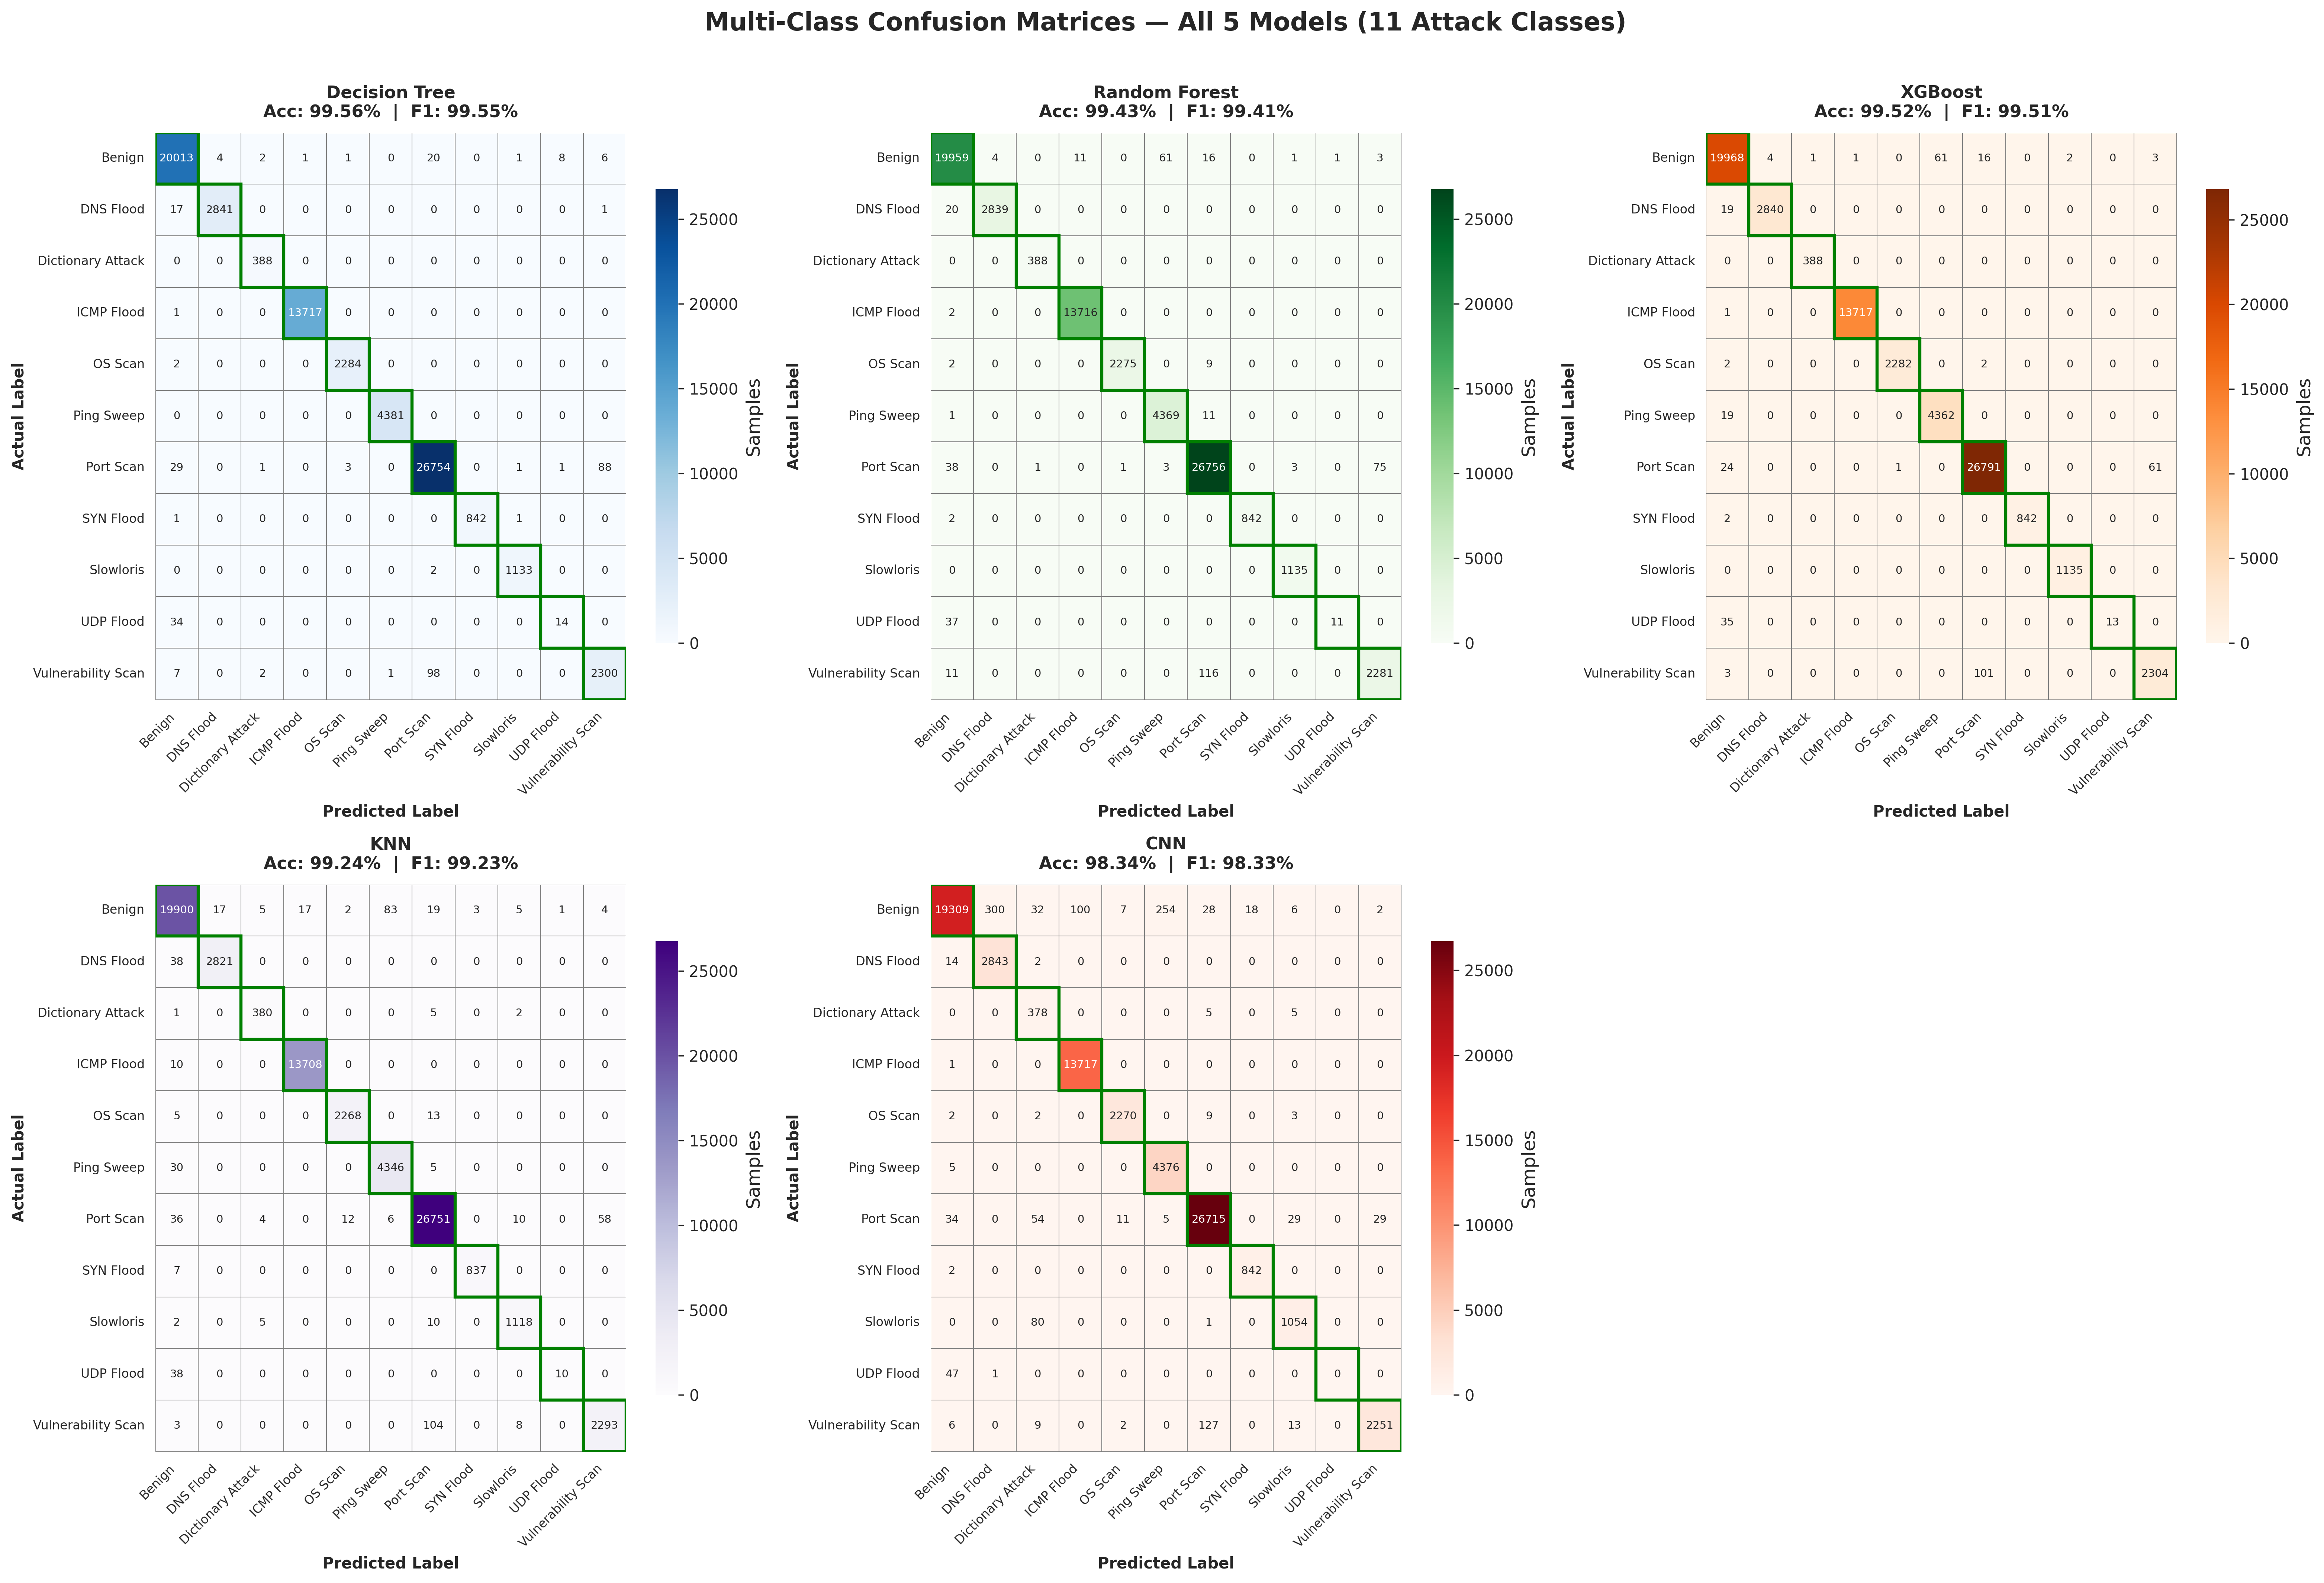
Fig. 4
Multi-class confusion matrices — 11 attack types
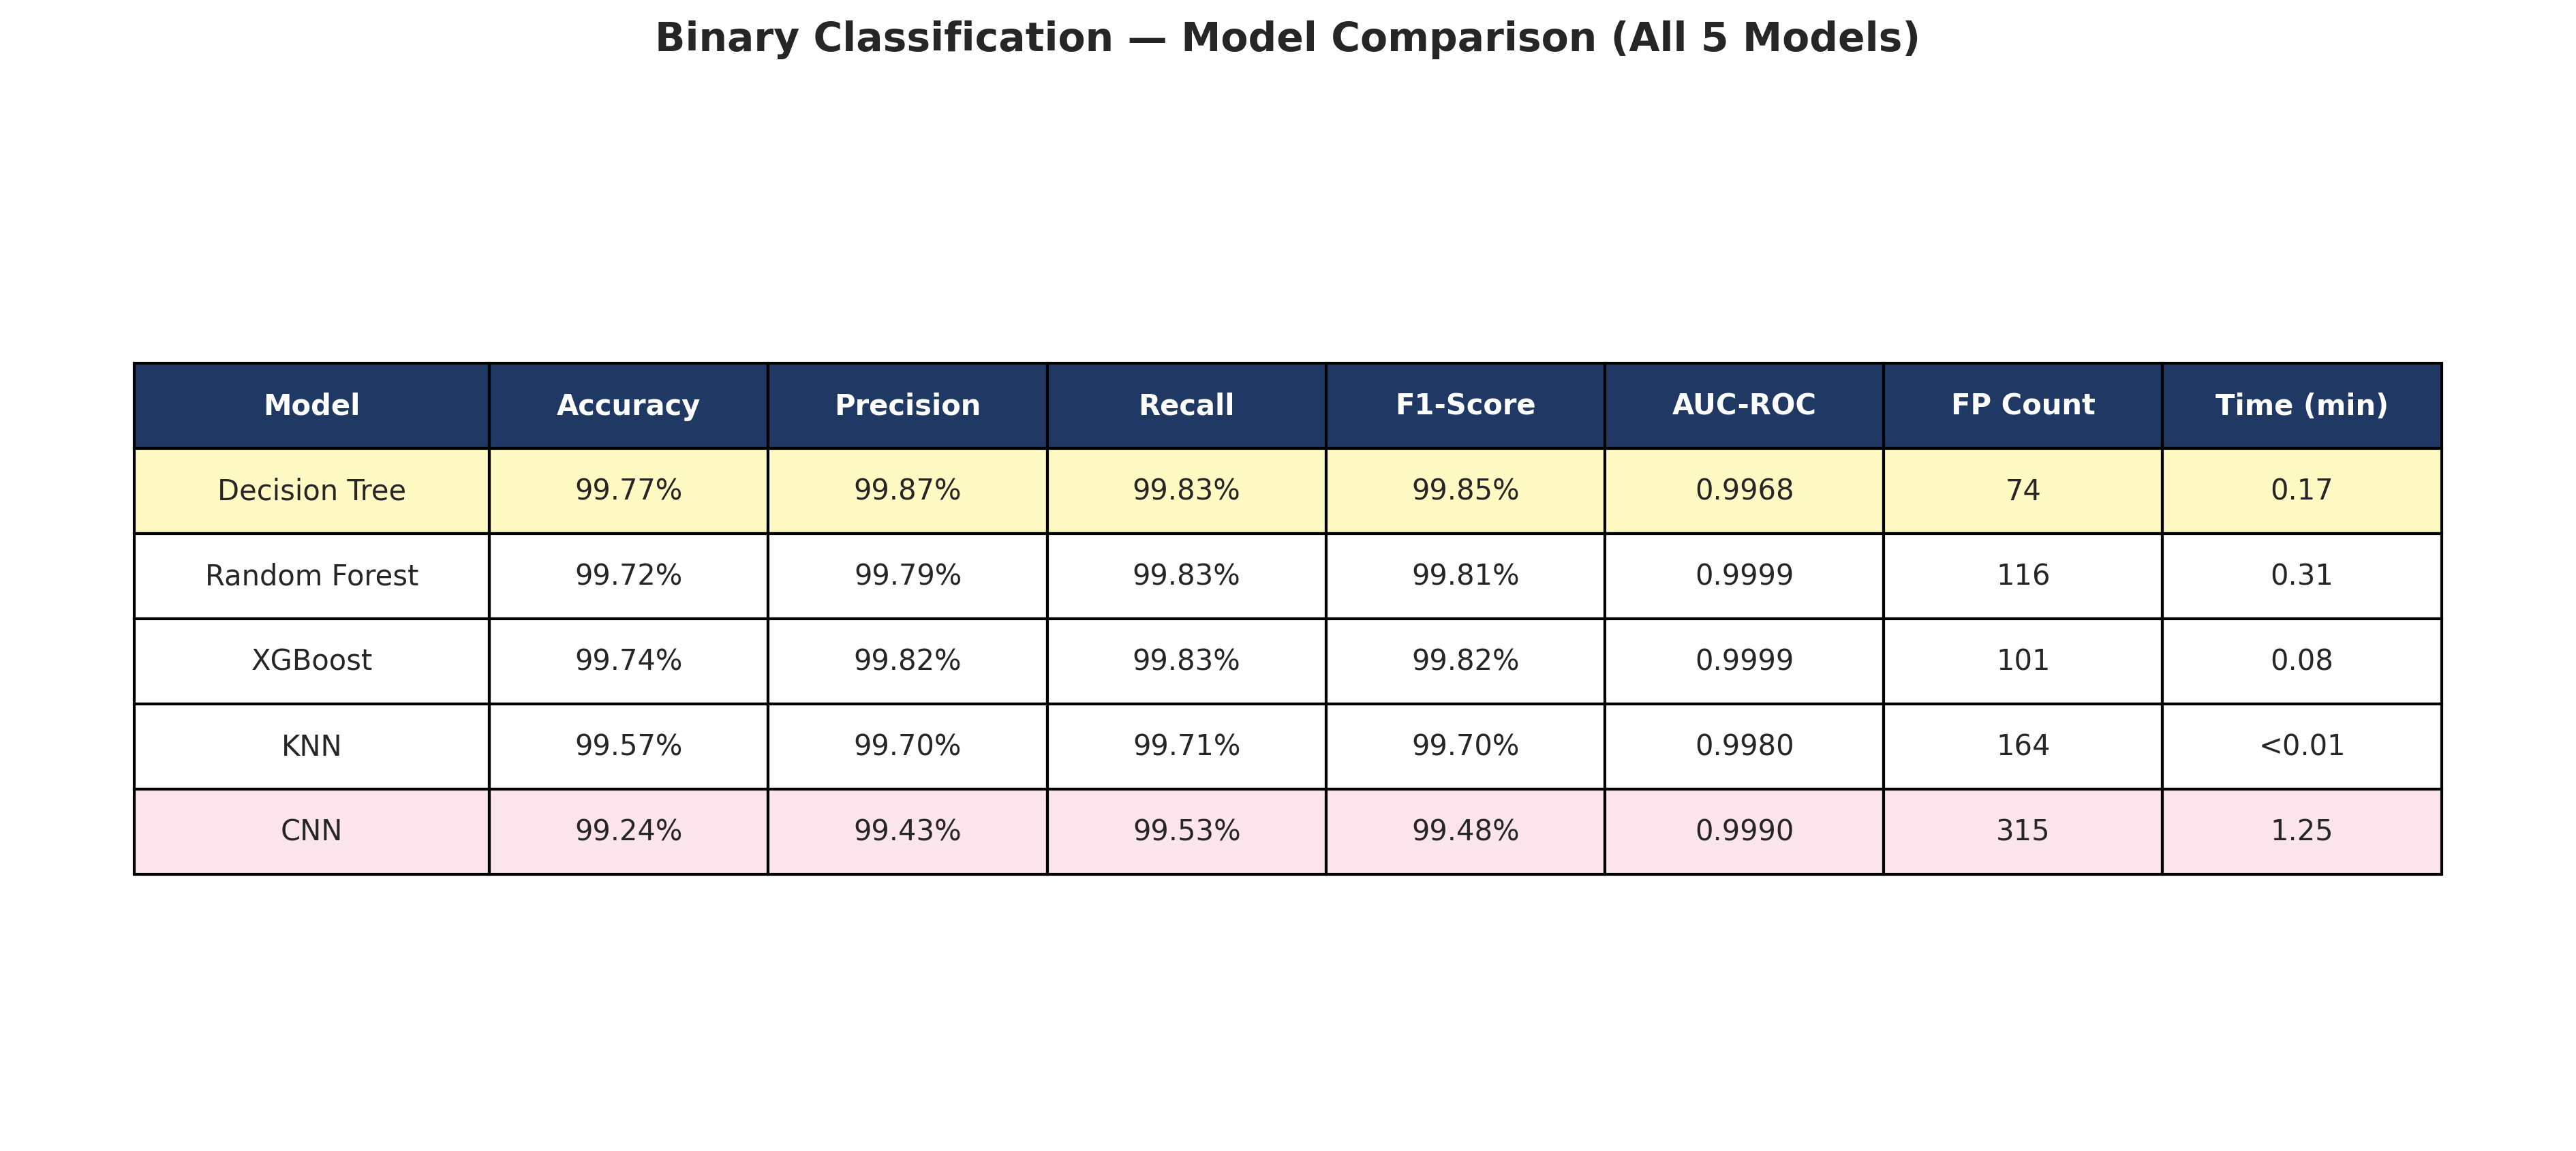
Fig. 5
Binary classification model comparison bar chart
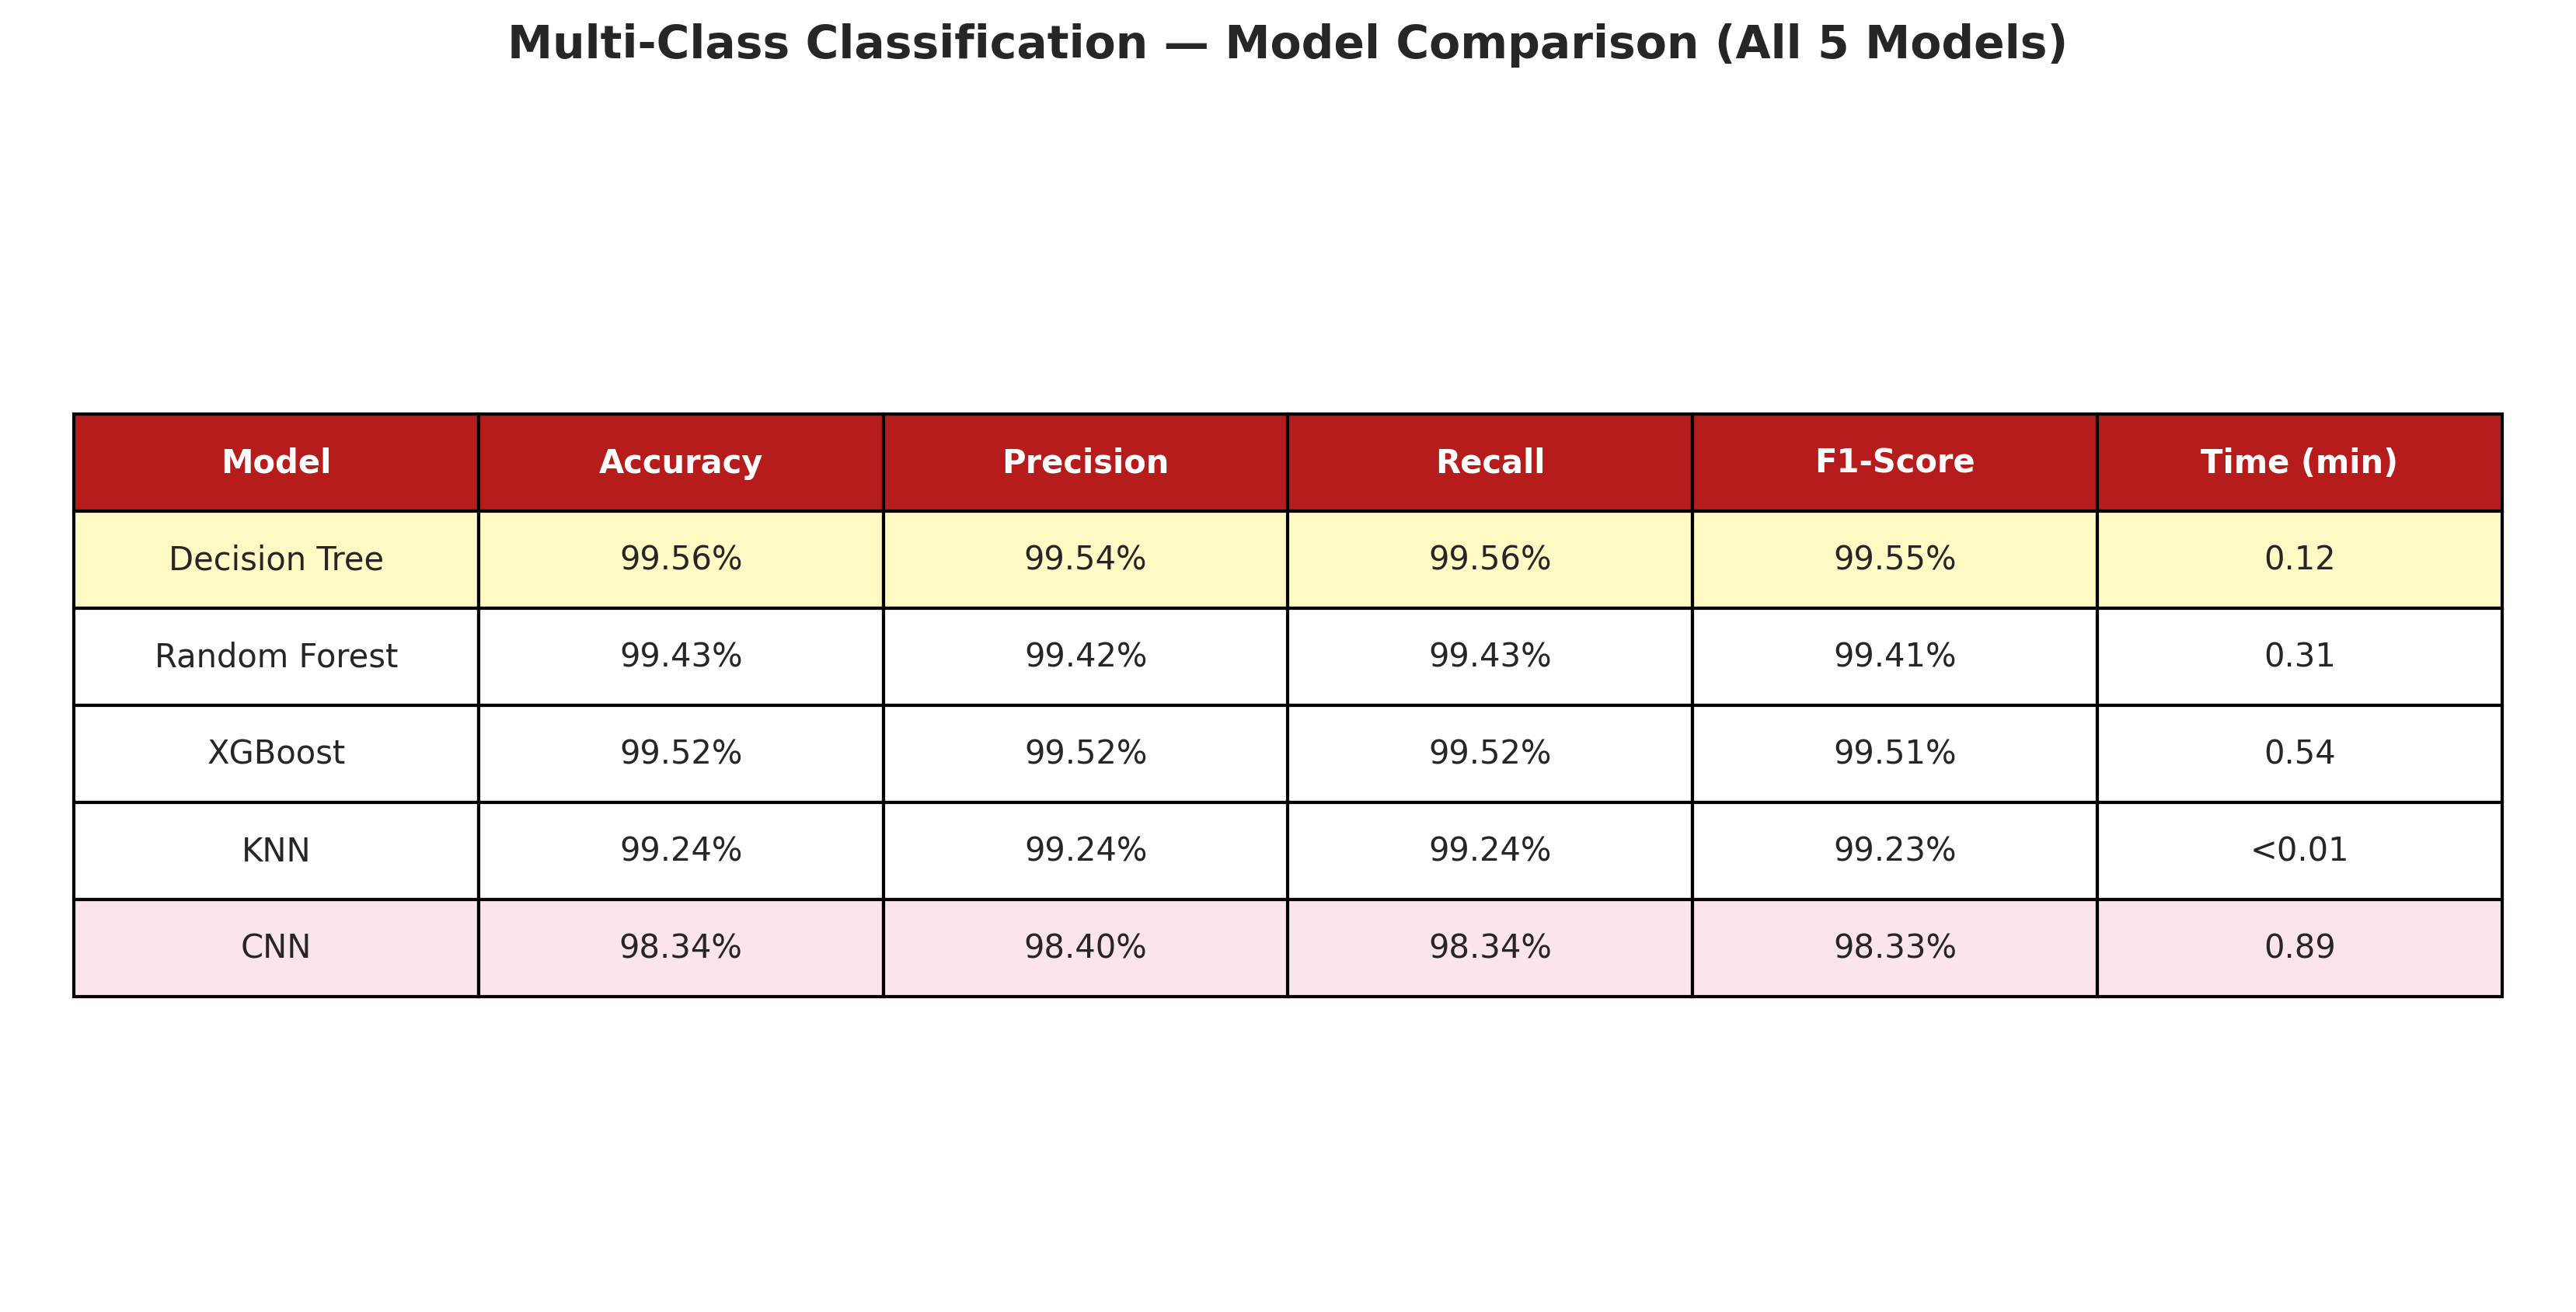
Fig. 6
Multi-class model comparison bar chart
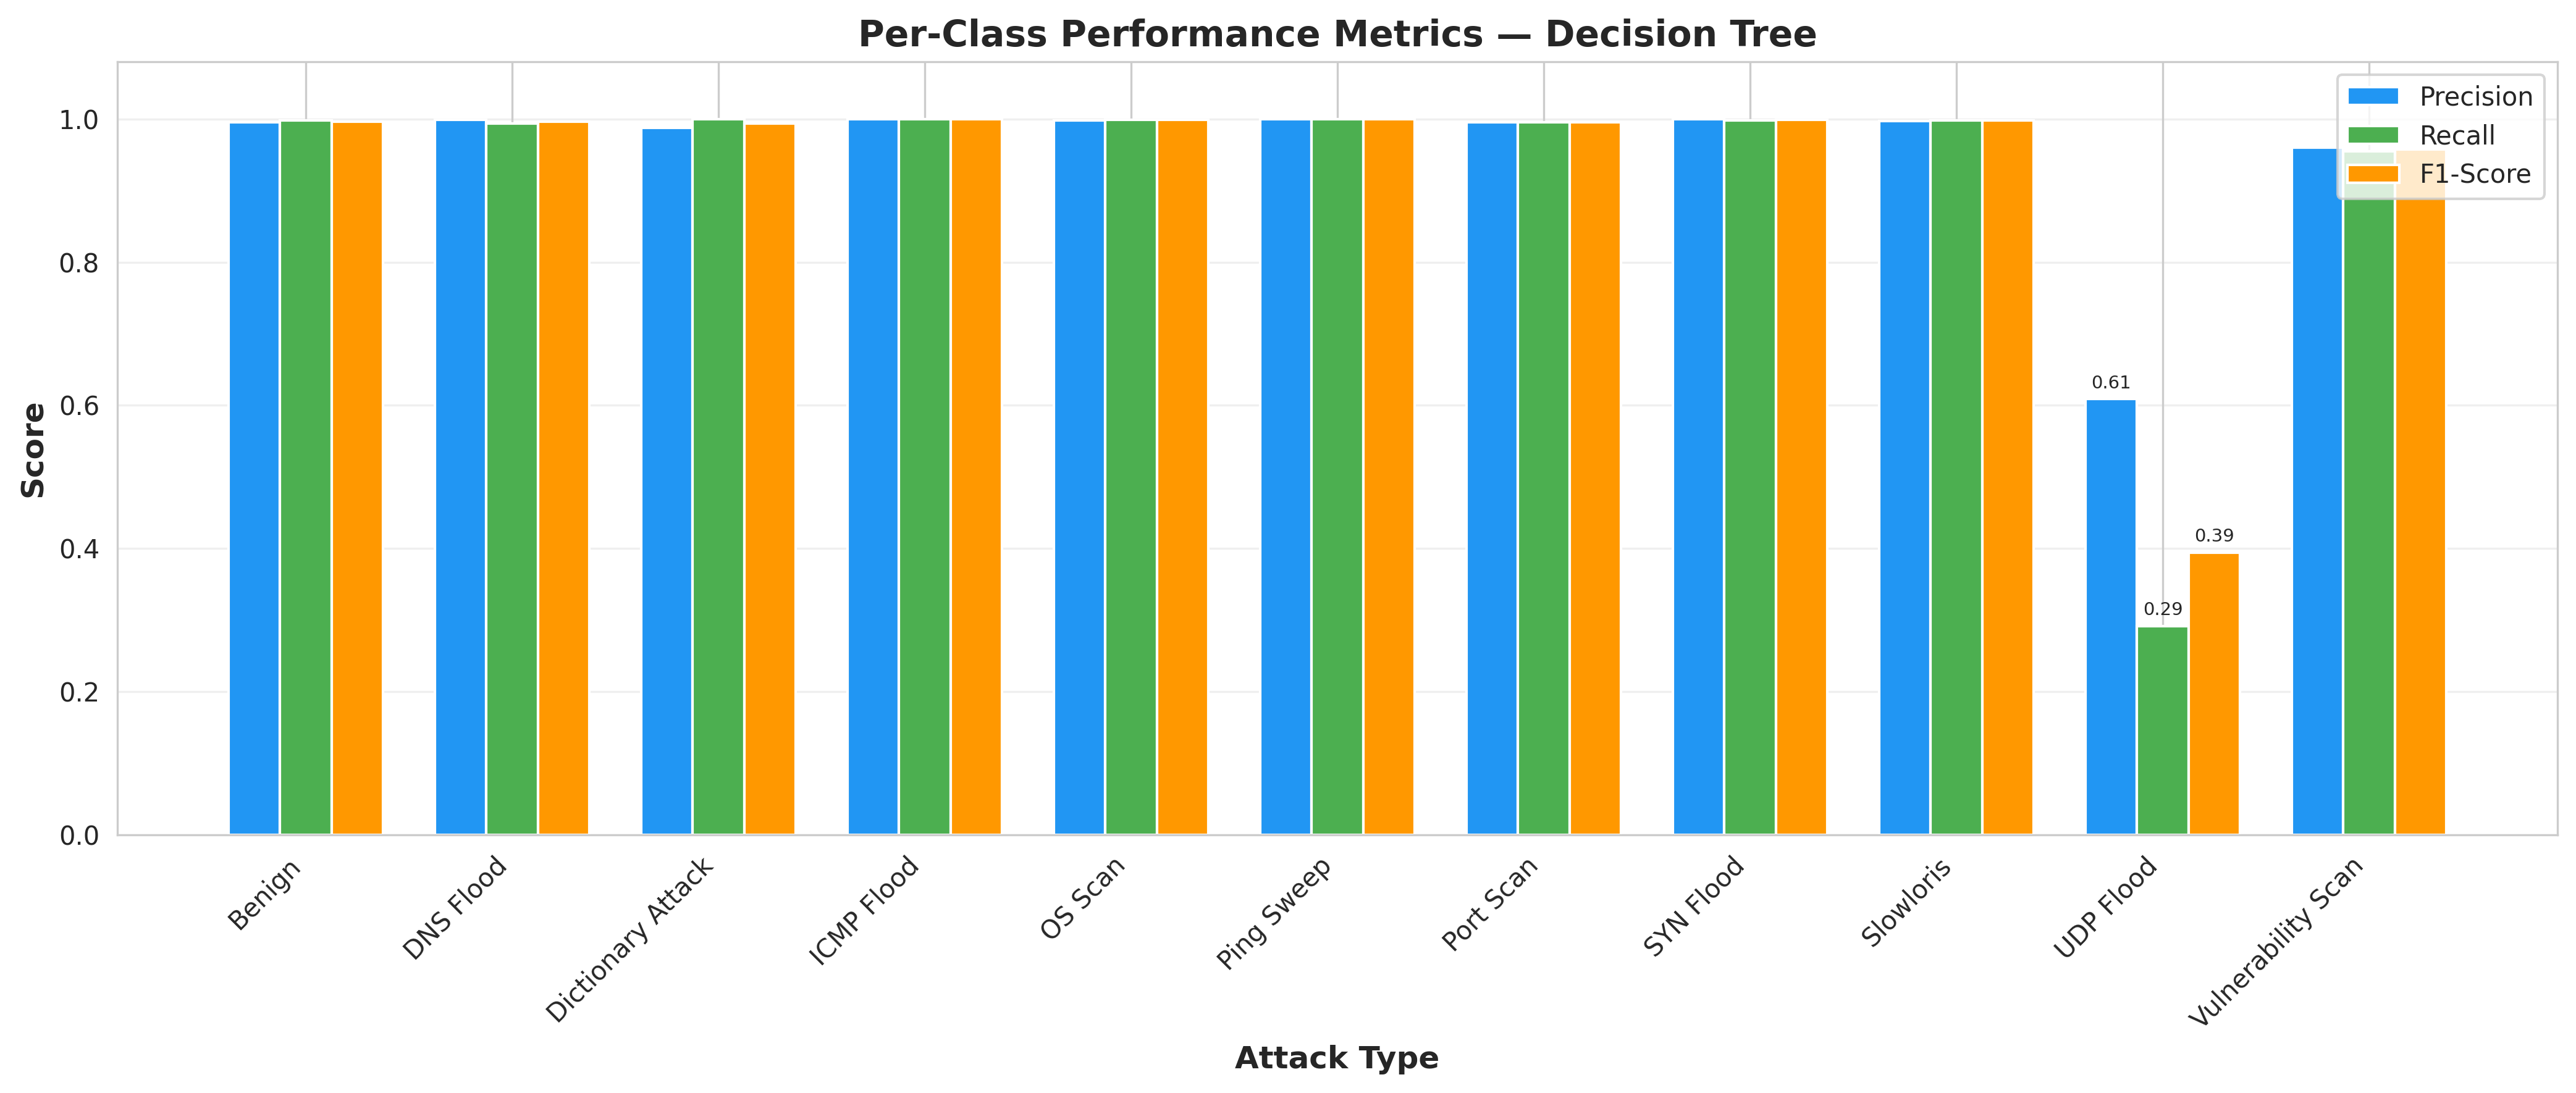
Fig. 7
Per-class performance — Decision Tree
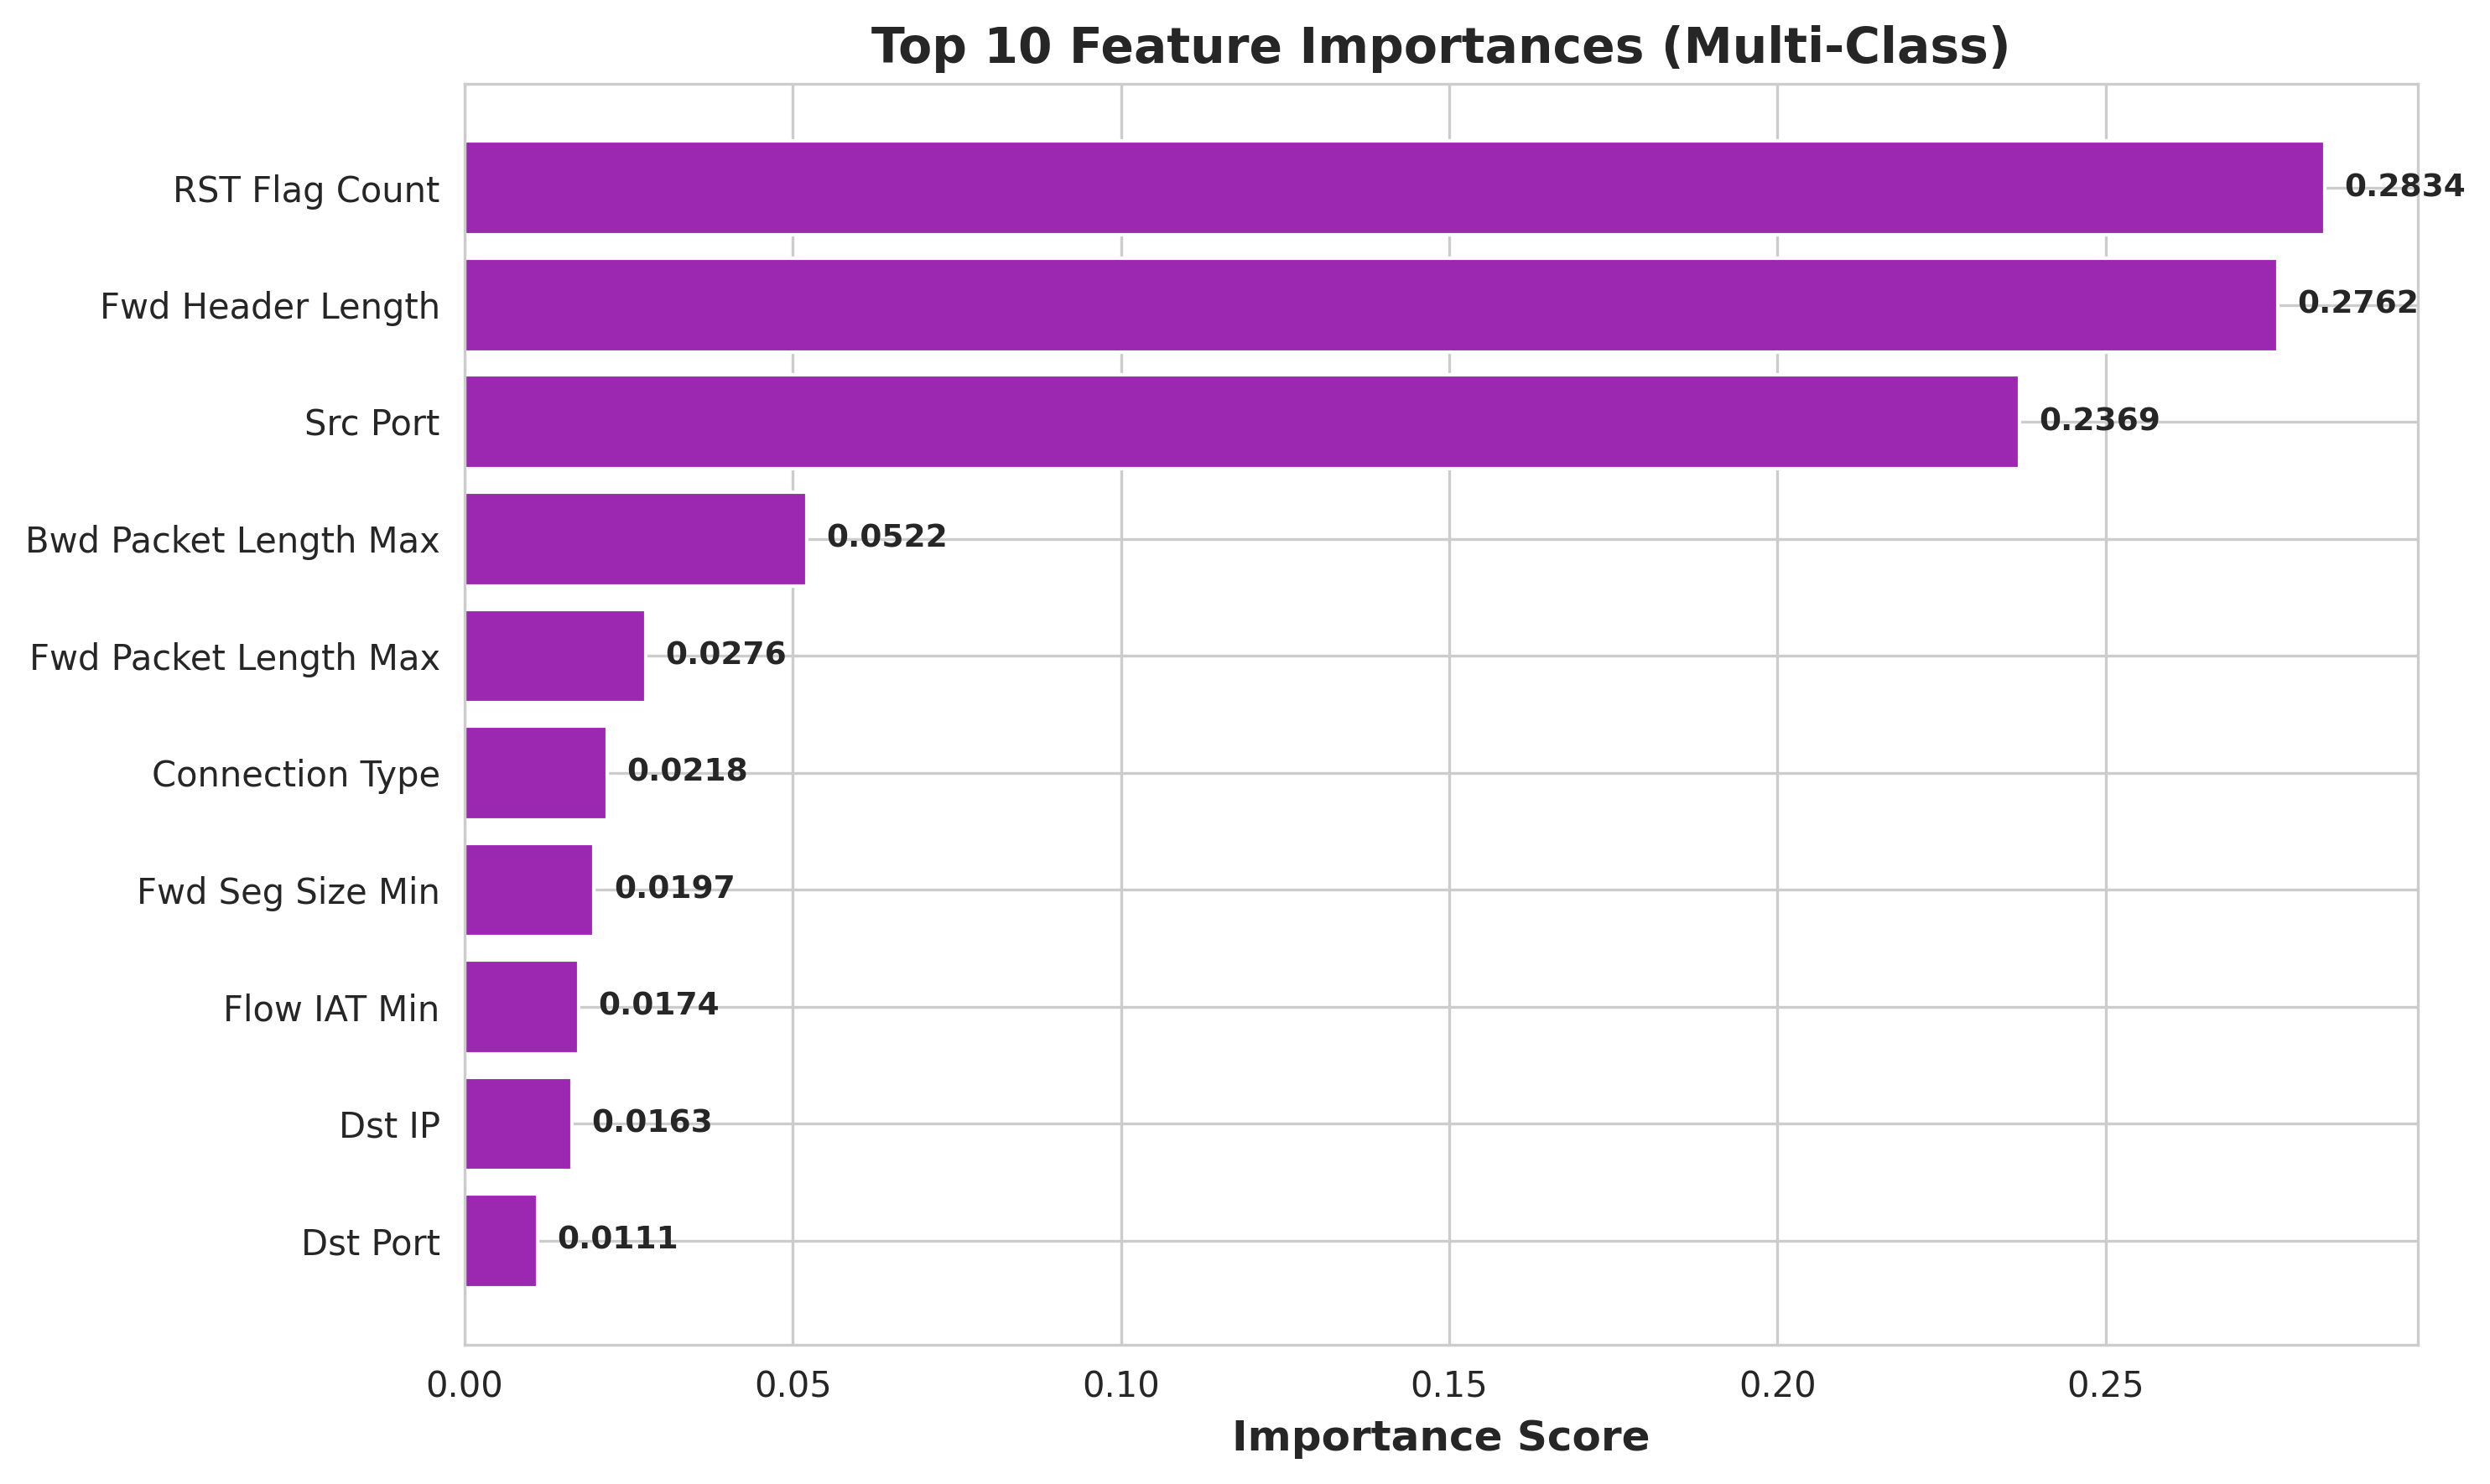
Fig. 8
Feature importance — Random Forest
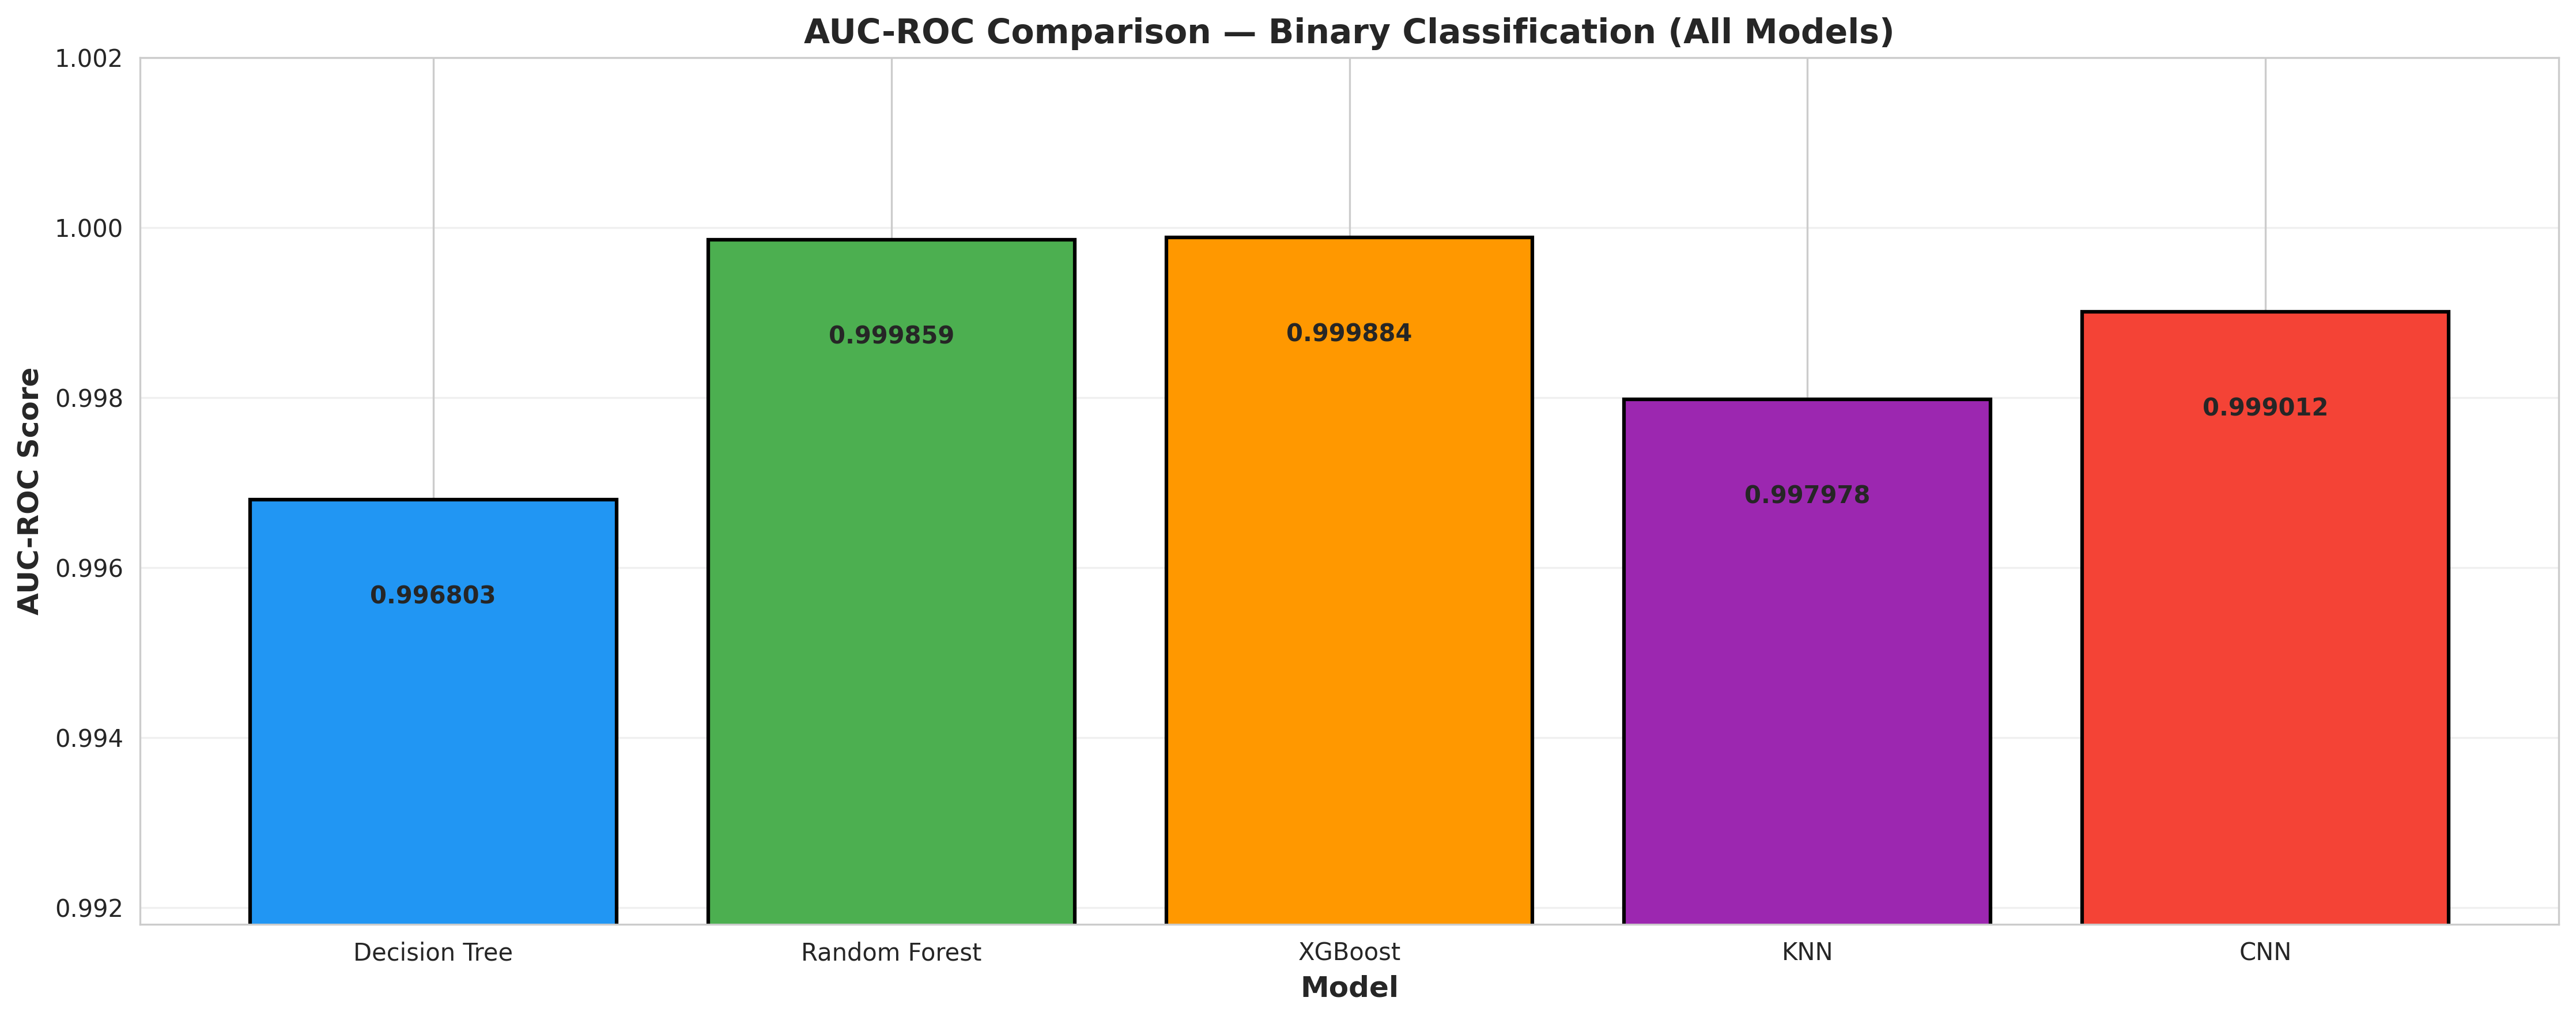
Fig. 9
AUC-ROC ranking — all models
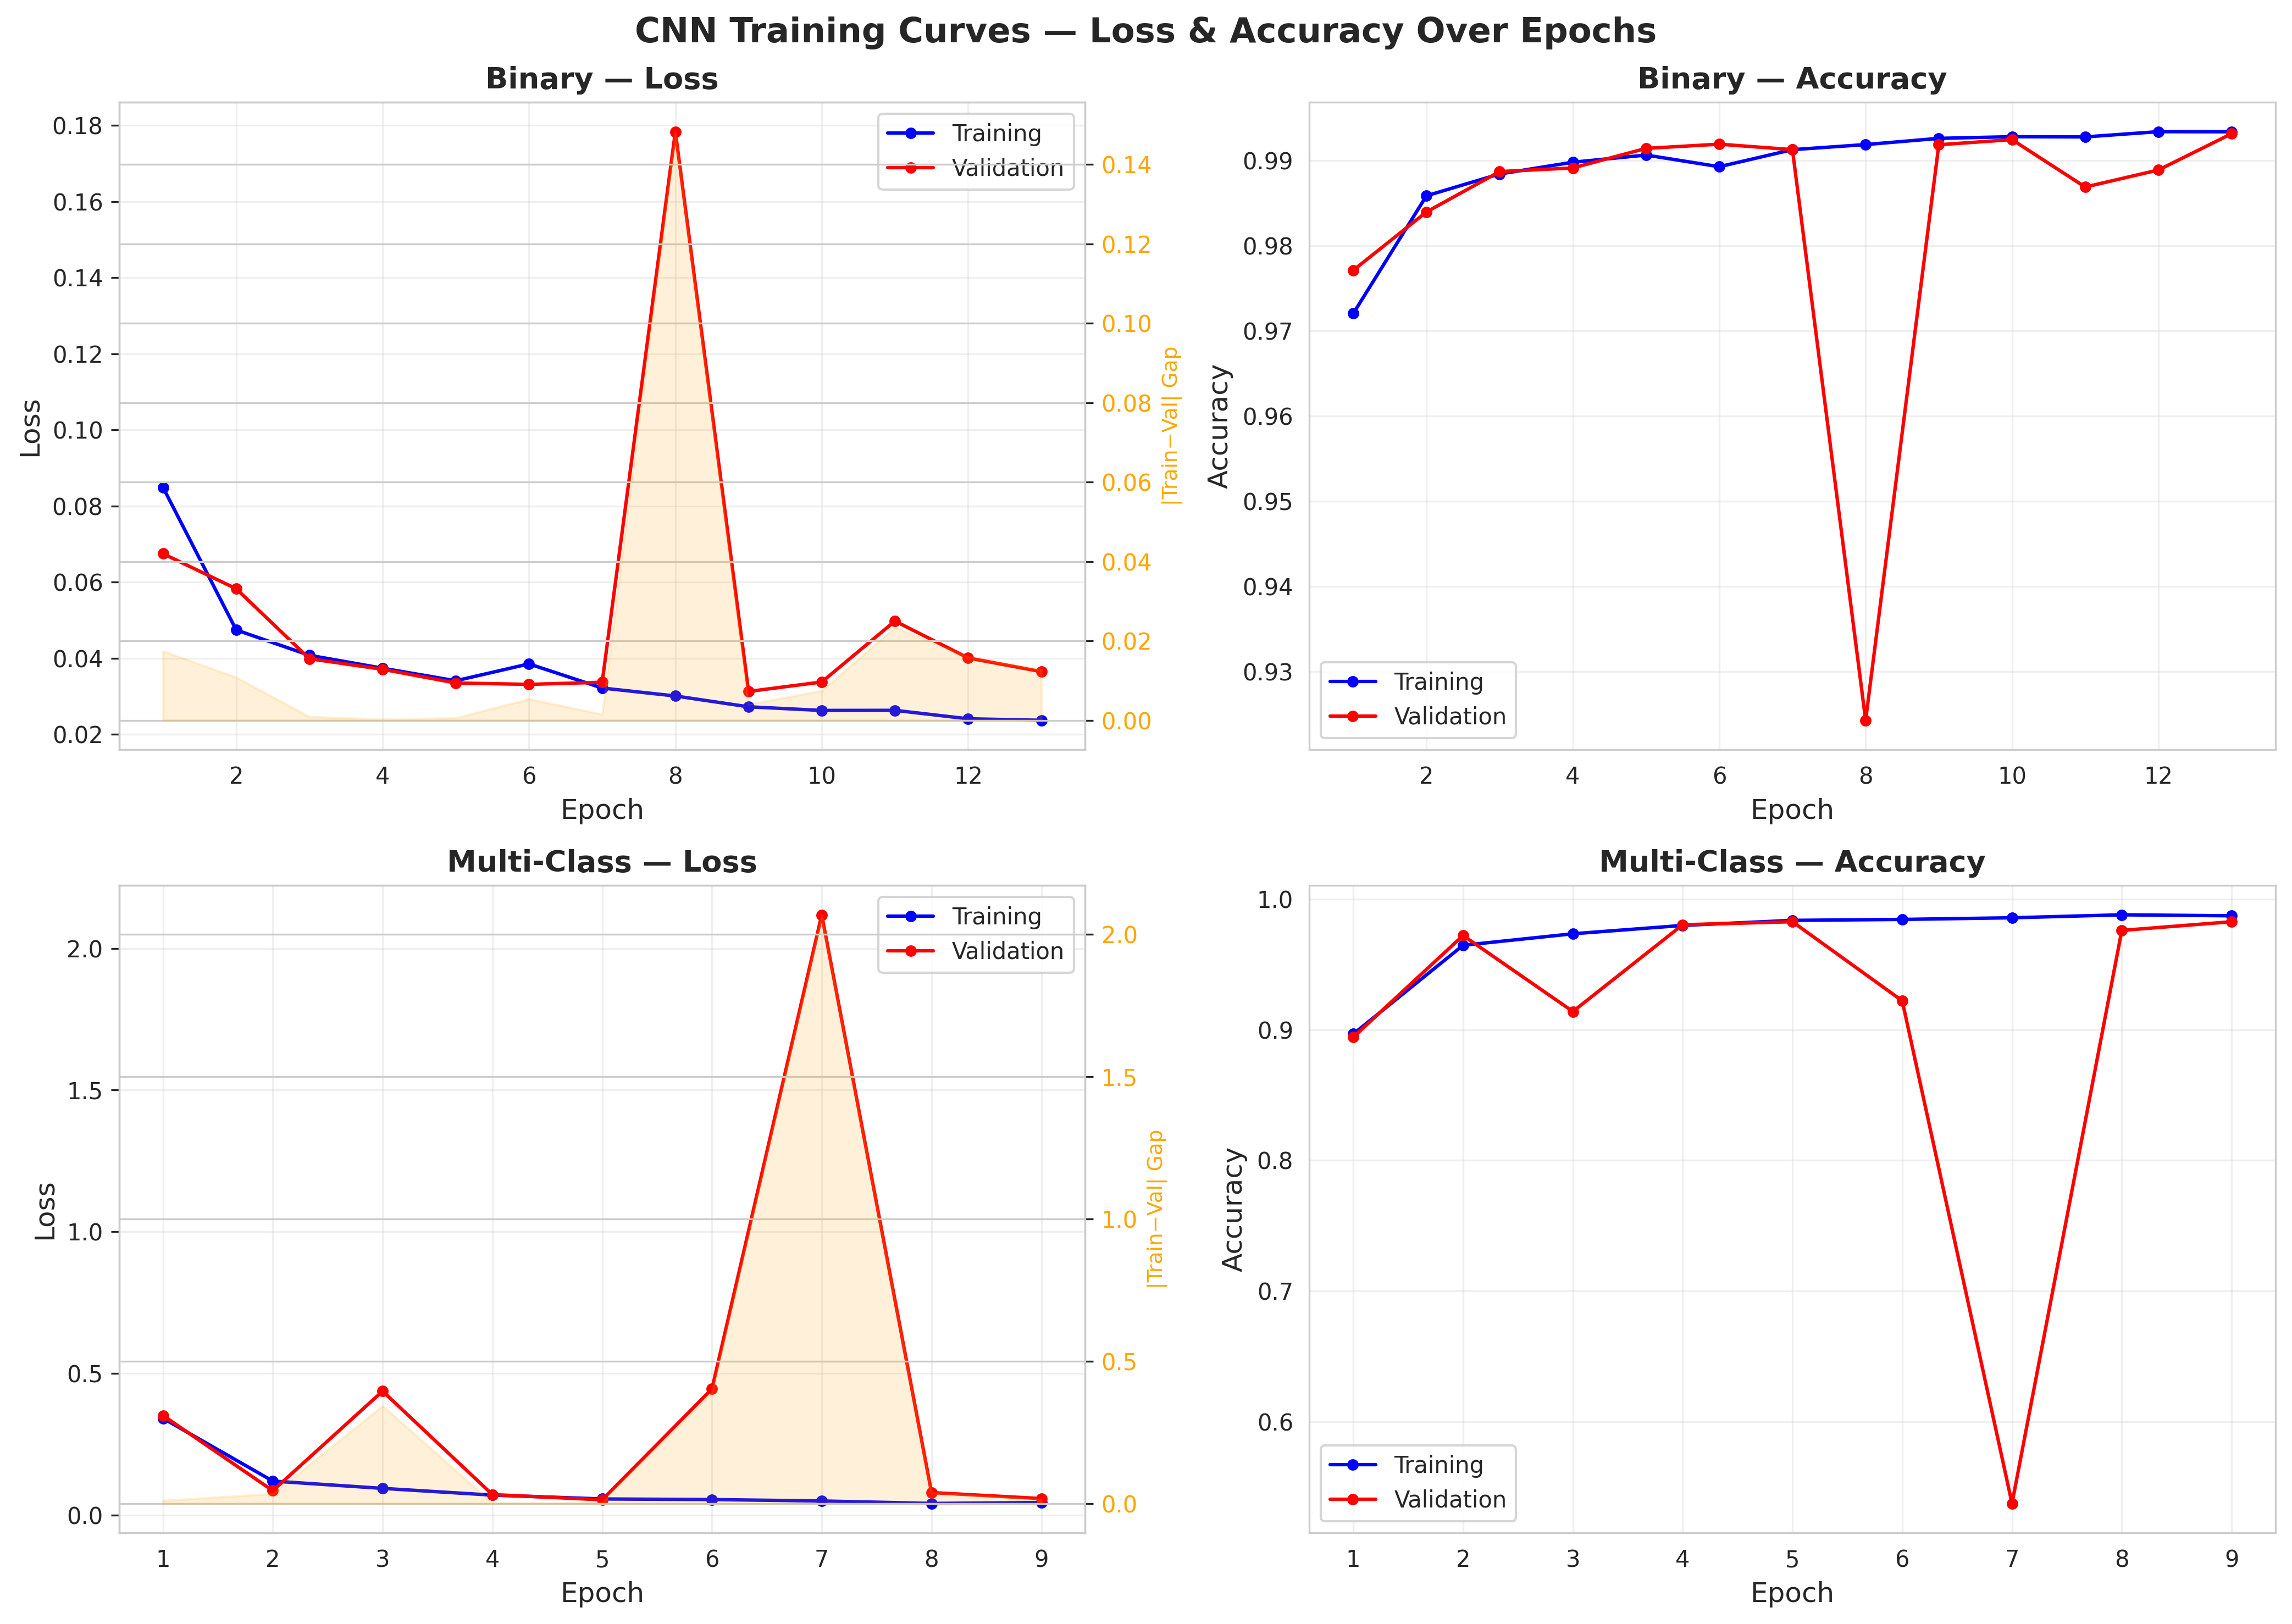
Fig. 10
CNN training curves — loss and accuracy over epochs
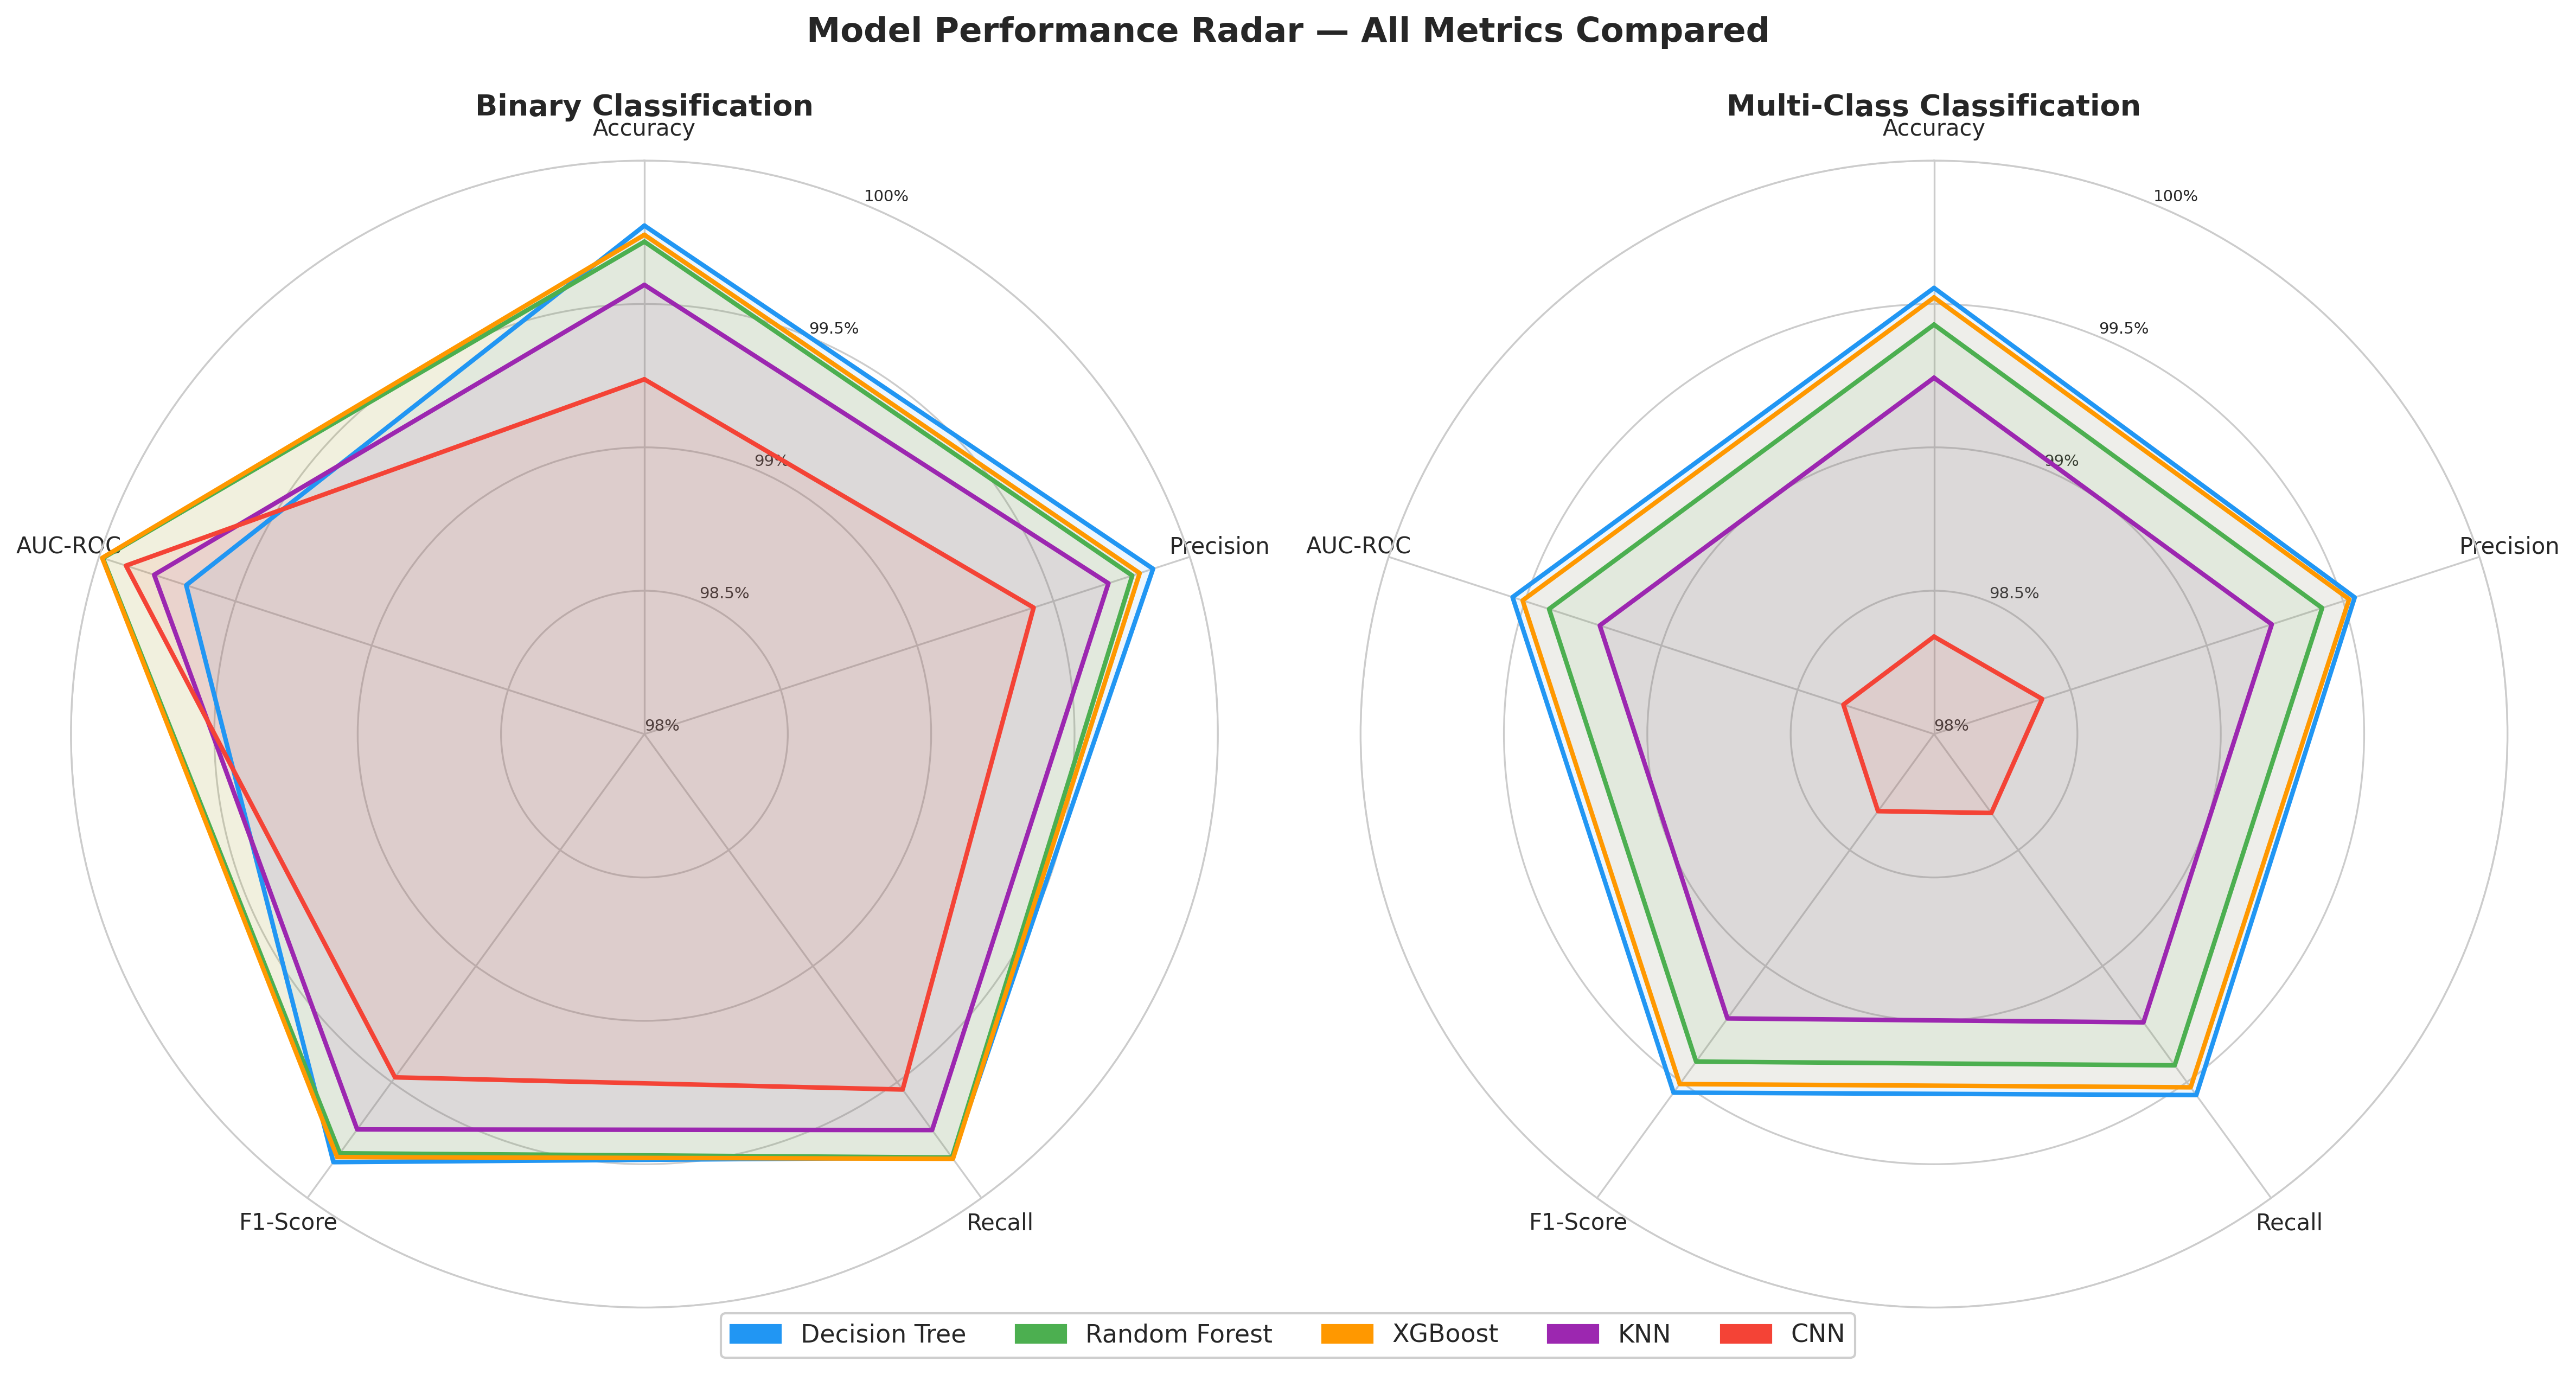
Fig. 11
Radar chart — multi-metric model comparison
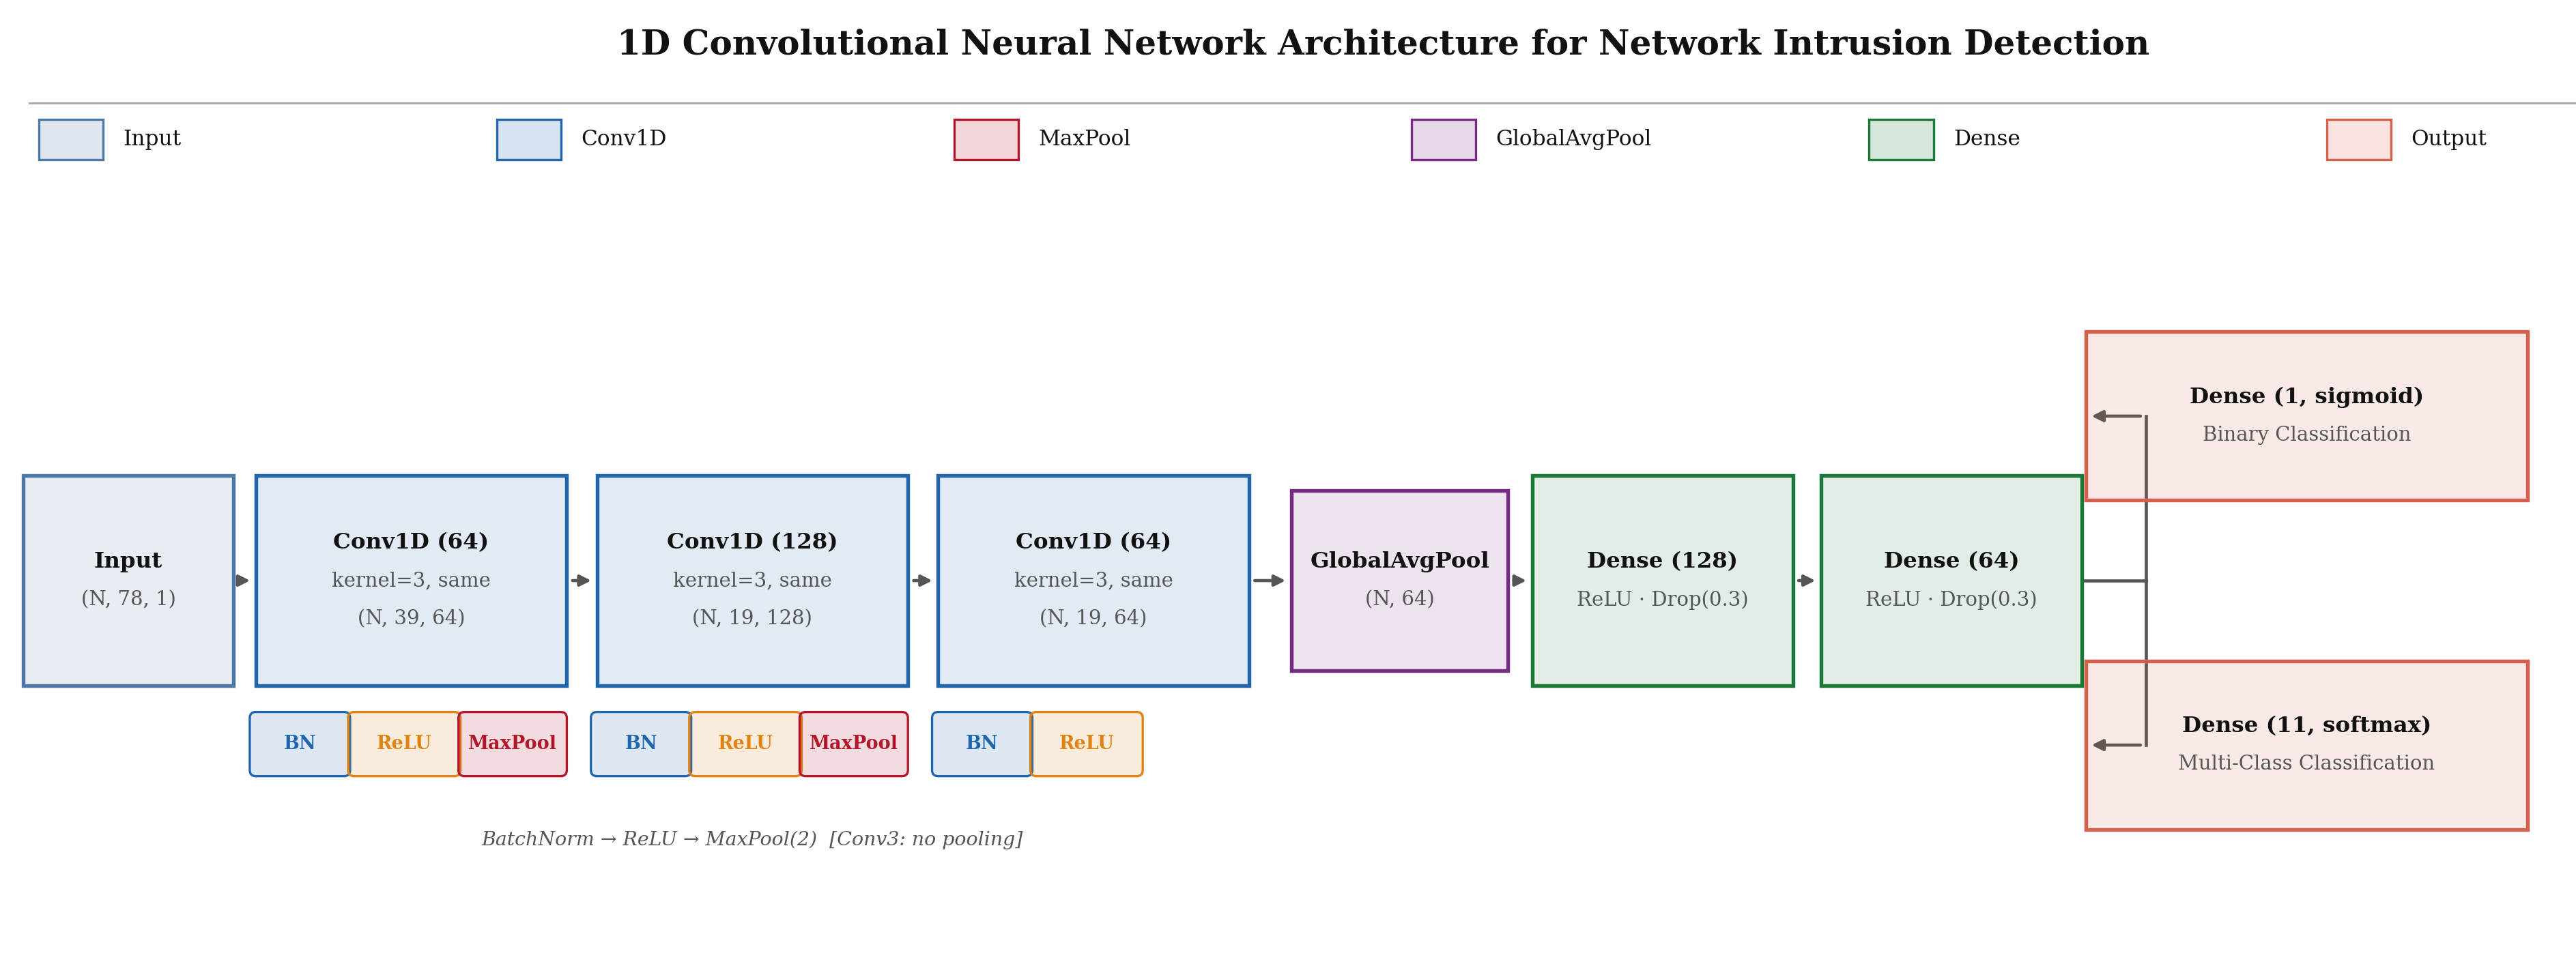
Fig. 12
1D CNN architecture diagram